- GBP/USD is starting the week pulling back down after the sharp spike up from last week.
- GBP/USD is trading below the 1.2600 handle after the London close.
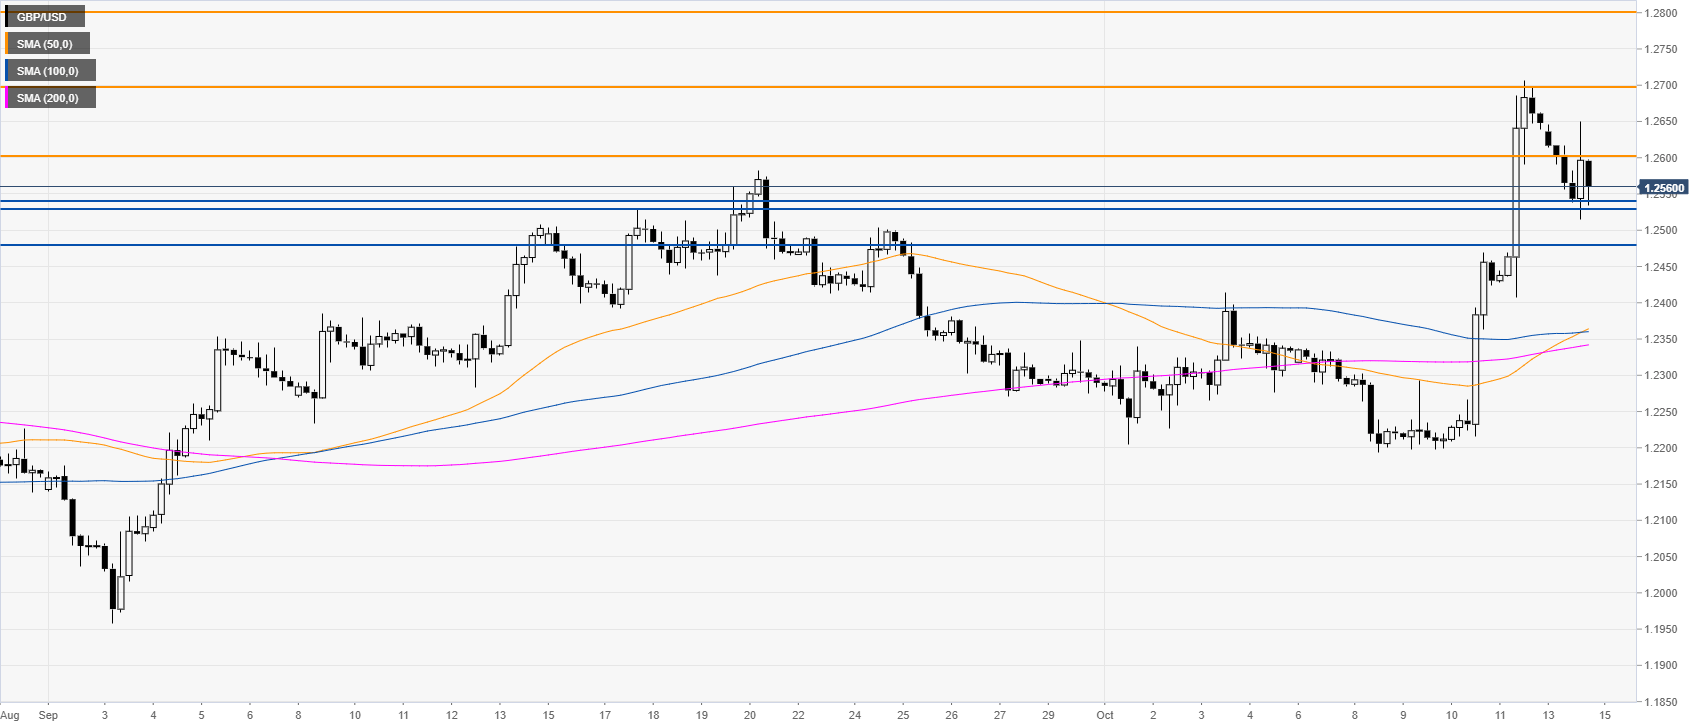
GBP/USD daily chart
GBP/USD, on the daily chart, is trading in a downtrend below the 200-day simple moving average (DSMA). This Monday, the spot has been consolidating last week’s advanced sparked by the Brexit deal optimism.

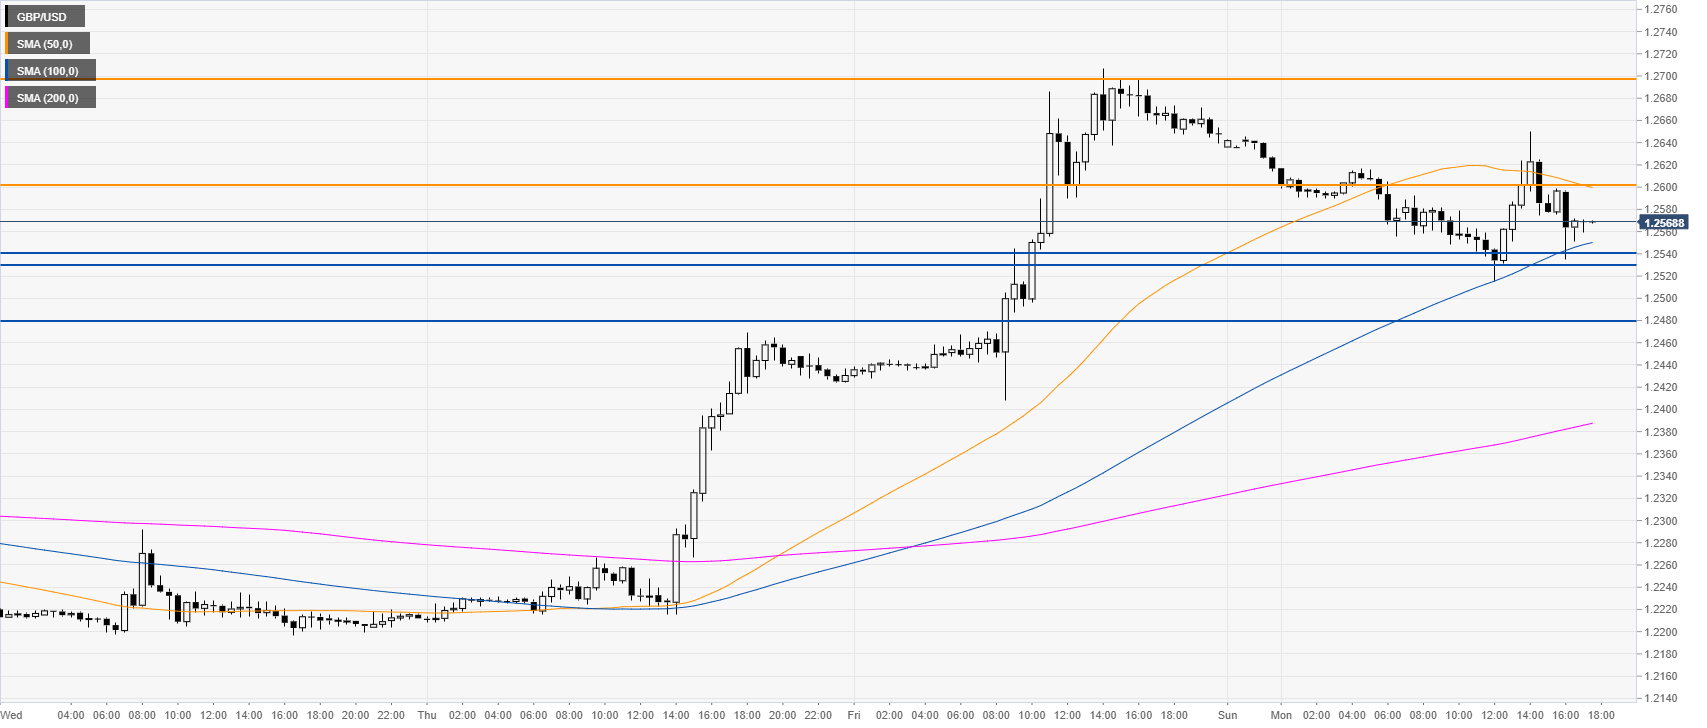
GBP/USD four-hour chart
GBP/USD is retracing down and trying to establish a base above the 1.2543/30 support zone. The market likely needs a daily close above the 1.2600 level to open the gates to 1.2700, according to the Technical Confluences Indicator.
GBP/USD 30-minute chart
The Sterling is trading above the 100 and 200 SMAs, suggesting bullish momentum in the near term. Support is seen at the 1.2543/30 zone and the 1.2477 level, according to the Technical Confluences Indicator.
Additional key levels
