- GBP/USD is retracing mildly, now below the 1.3000 figure after the London close.
- The level to beat for bulls is the 1.3025 resistance.
- Brexit headlines remain the main drivers of the currency pair.
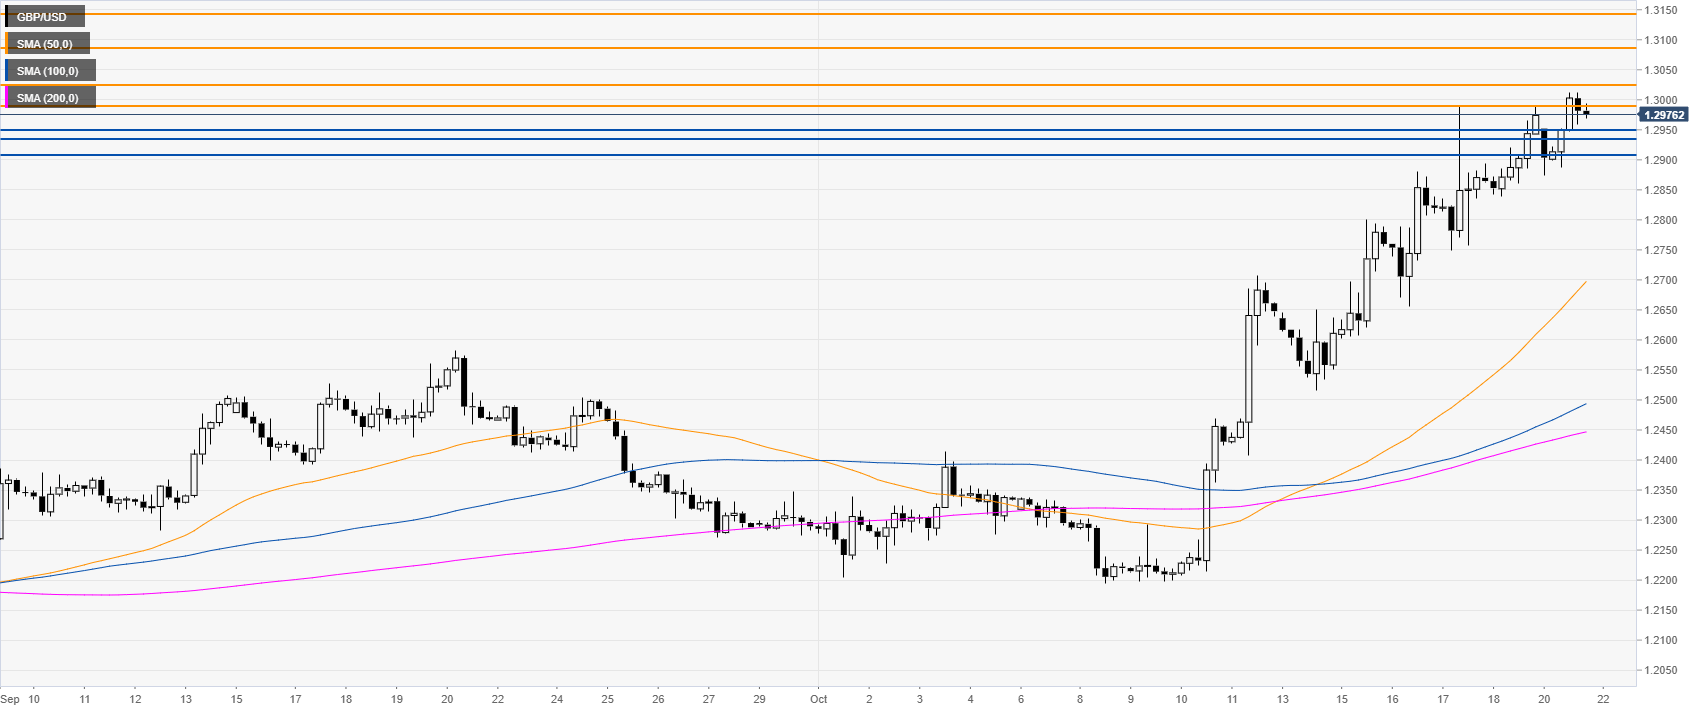
GBP/USD daily chart
The Pound, on the daily chart, is spiking above its main daily simple moving averages (DSMAs) while trading at levels not seen since mid-May 2019. The Brexit deal optimism is behind the GBP euphoria of the last weeks.

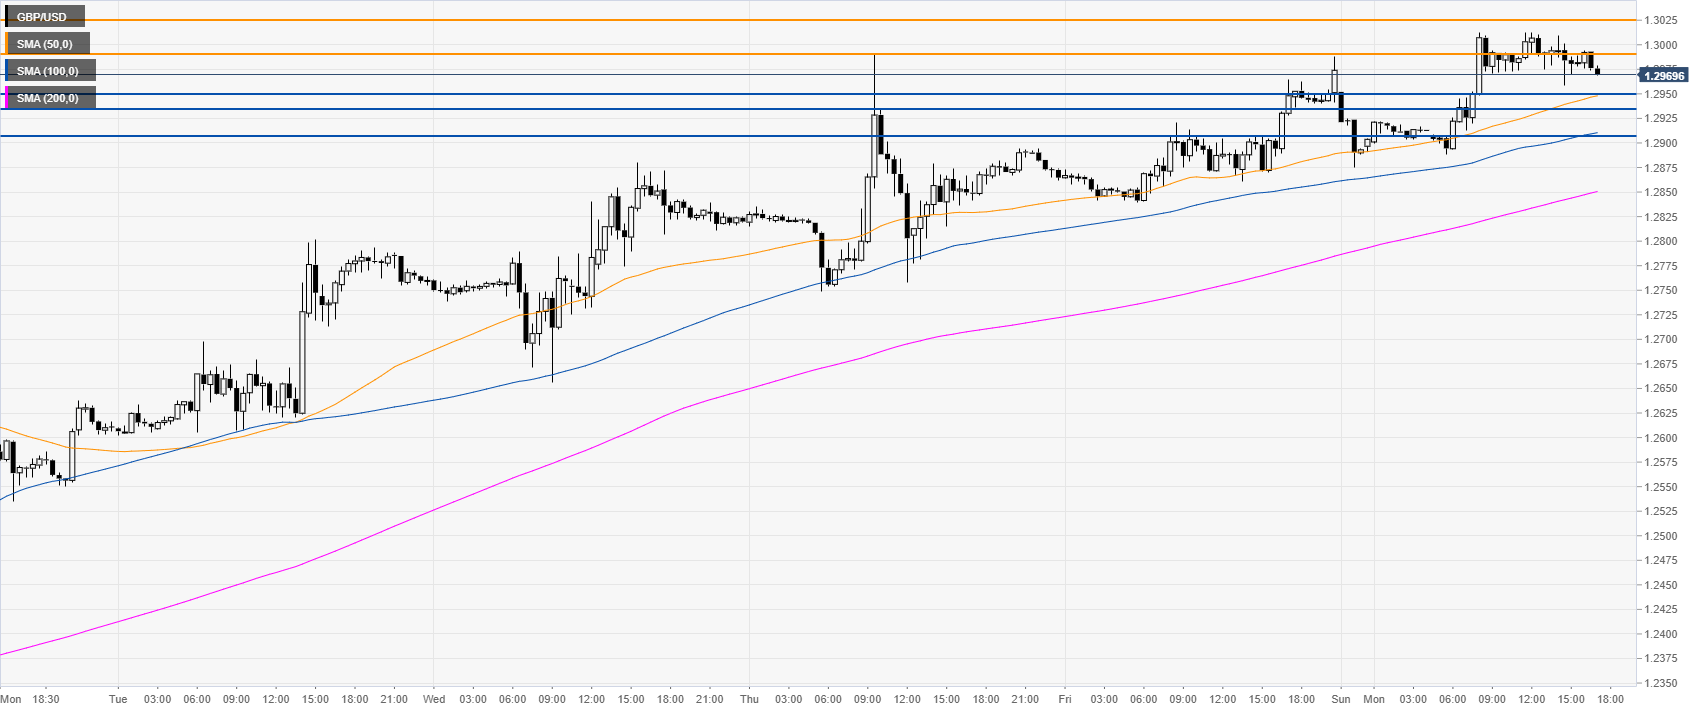
GBP/USD four-hour chart
The Cable is trading in a bull channel above its main SMAs. A break above 1.3025 resistance can drive the market towards 1.3085 and 1.3140 resistances, according to the Technical Confluences Indicator.
GBP/USD 30-minute chart
GBP/USD is trading above its main SMAs, suggesting bullish momentum in the near term. Support is seen at 1.2950/33 zone and the 1.2906 price level, according to the Technical Confluences Indicator.
Additional key levels
