- GBP/USD is bouncing from the 1.2815 support level.
- The level to beat for sellers is the 1.2815/1.2772 support zone.
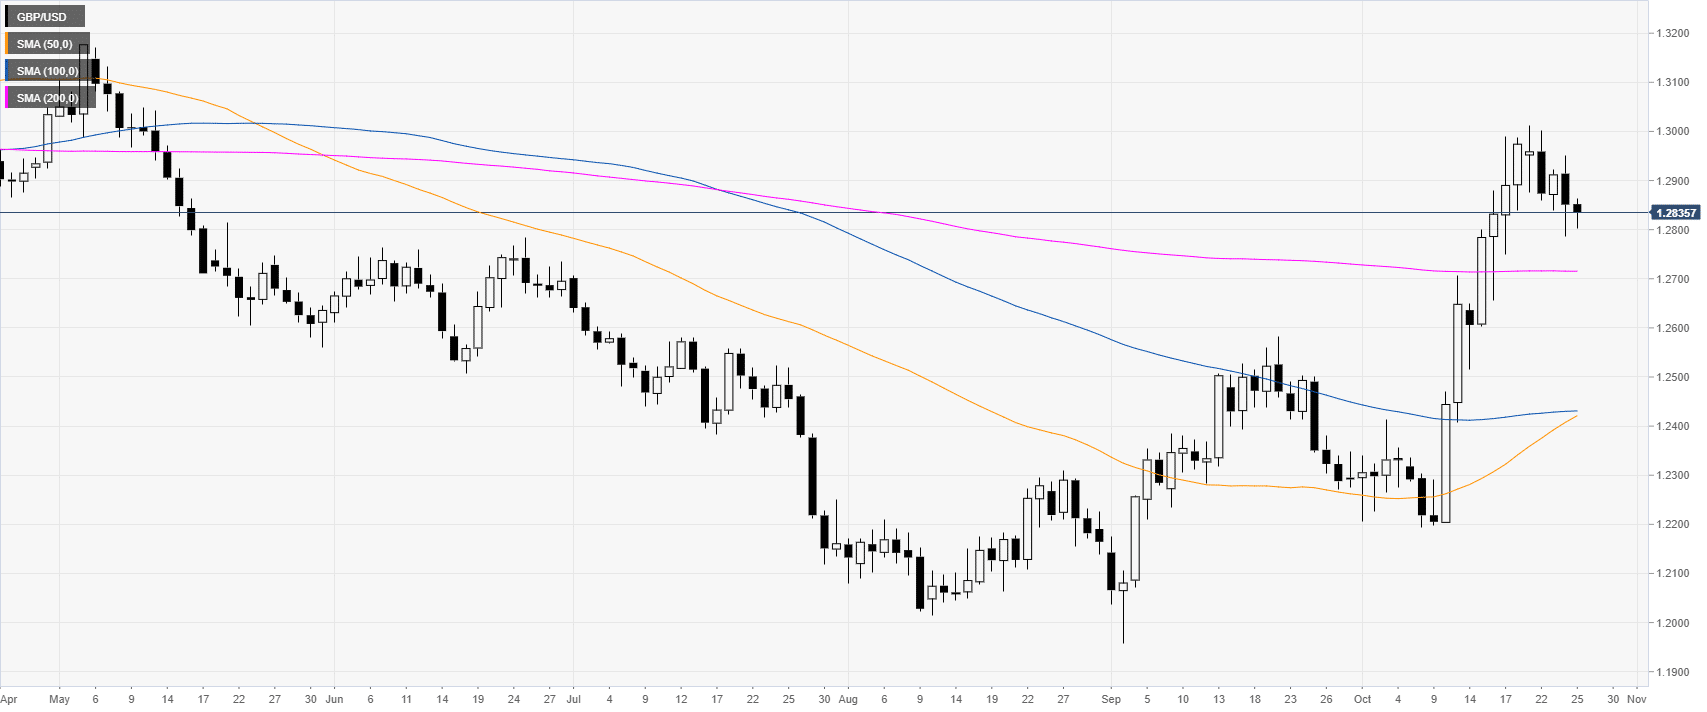
GBP/USD daily chart
In October, the Sterling spiked up above the main daily simple moving averages (DSMAs) and reached levels not seen since mid-May 2019. The Brexit headlines remain the main drivers behind the Pound moves.
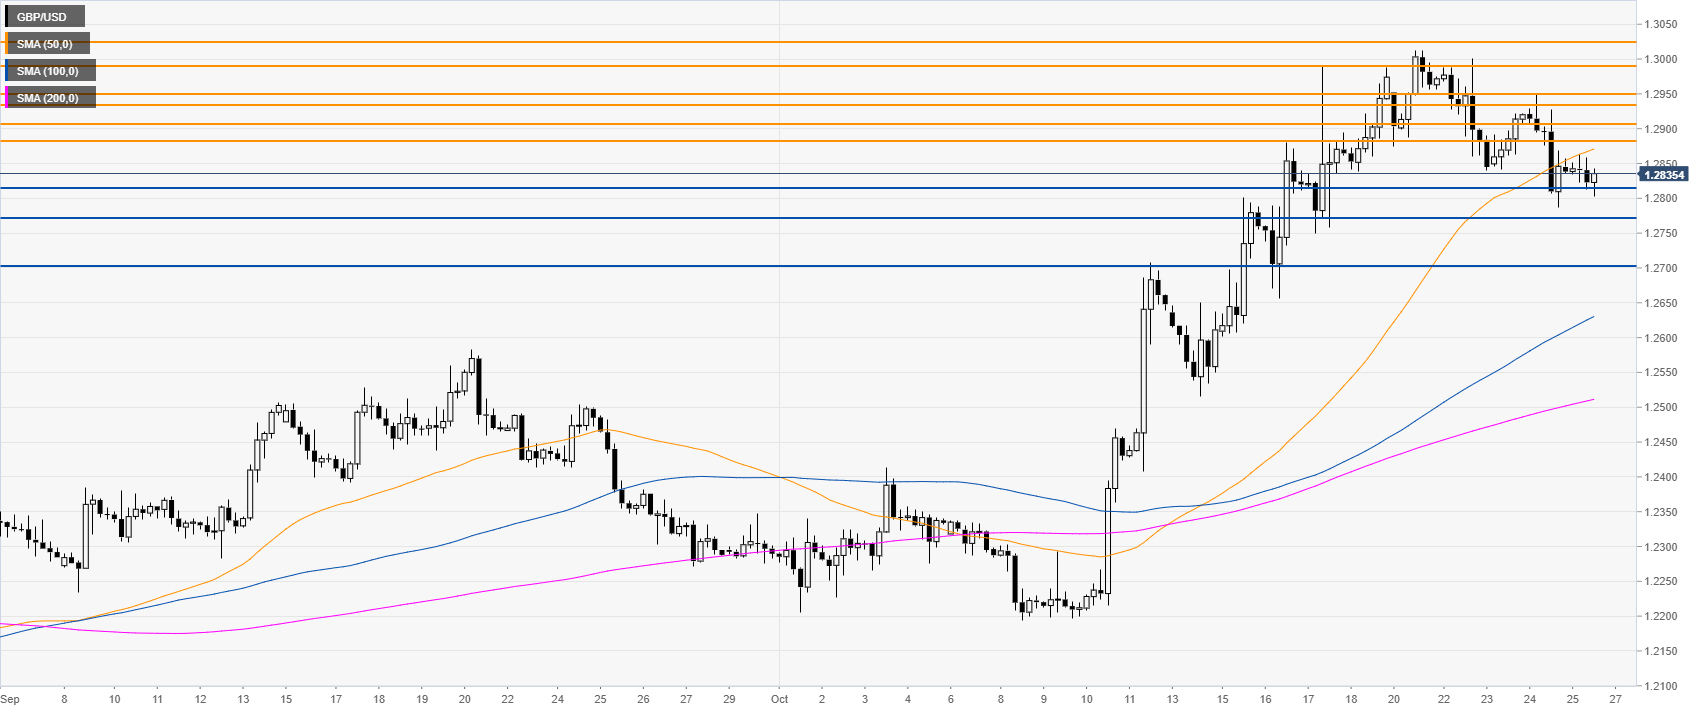
GBP/USD four-hour chart
GBP/USD is pulling back down below the 1.2900 handle and its 50 SMA. Sellers need a daily break below the 1.2815/1.2772 support zone to potentially reach the 1.2700 handle, according to the Technical Confluences Indicator.
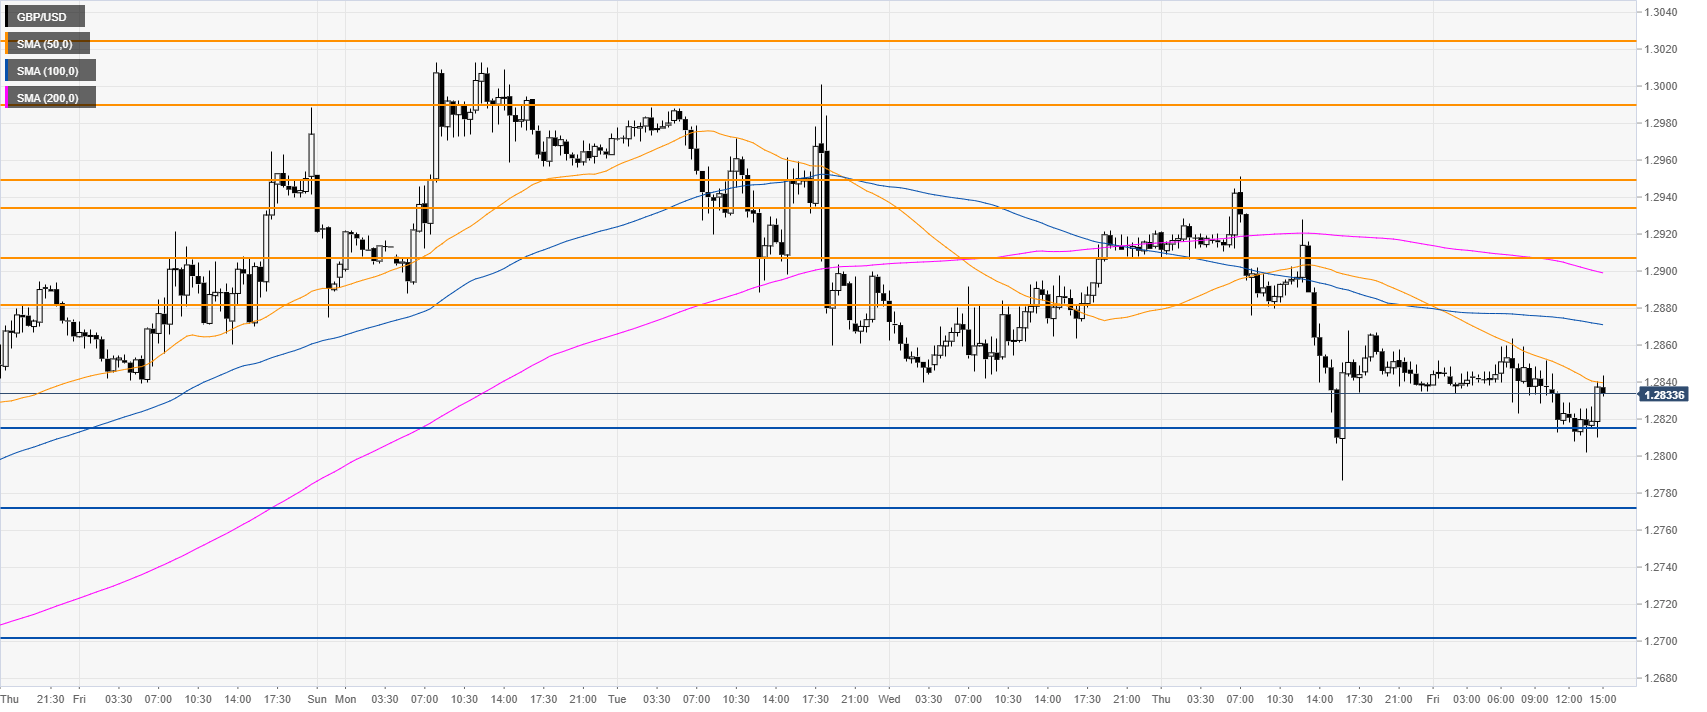
GBP/USD 30-minute chart
GBP/USD is trading below its main SMAs, suggesting a bearish bias in the near term. Immediate resistances are seen at the 1.2880 and 1.2908 price levels, according to the Technical Confluences Indicator.
Additional key levels
