- GBP/USD is trading near Monday’s lows after it failed to breakout above the 1.3300 figure.
- GBP/USD bullish momentum is slowing down as it broke the bullish trendline. A test of the 1.3200 level becomes a possibility.
- Resistances becomes now the 1.3250 and the 1.3300 levels.
GBP/USD 15-minute chart
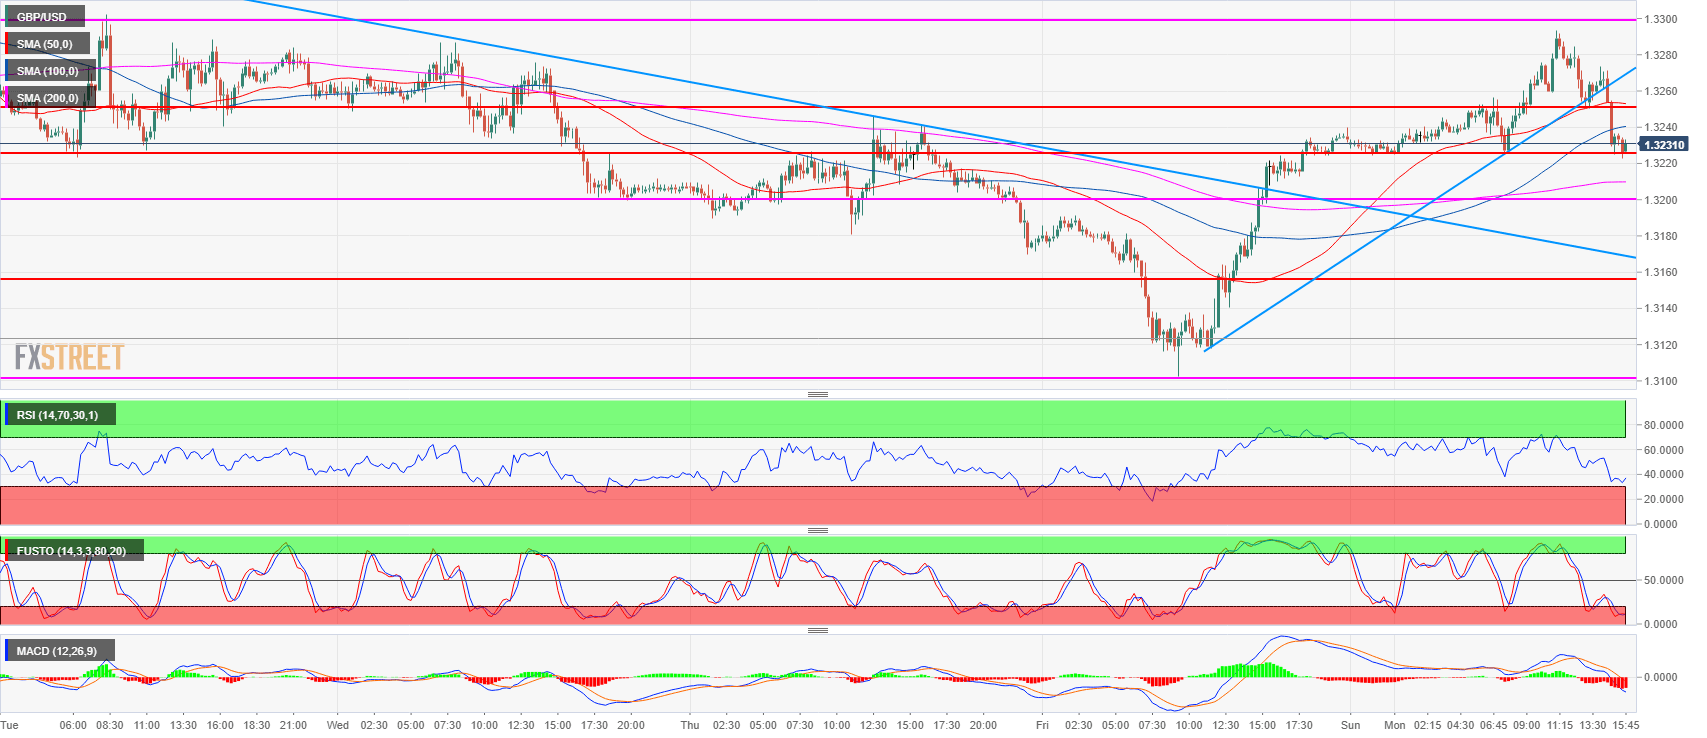
Spot rate: 1.3228
Relative change: 0.23%
High: 1.3293
Low: 1.3222
Trend: Neutral to bearish
Resistance 1: 1.3250 June 4 high
Resistance 2: 1.3300 figure
Resistance 3: 1.3363 last week’s high
Resistance 4: 1.3400 figure
Resistance 5: 1.3472 June’s high
Support 1: 1.3225 intraday swing low
Support 2: 1.3200 figure
Support 3: 1.3155 former breakout point
Support 4: 1.3100 figure
Support 5: 1.3049 current 2018 low
Support 6: 1.3027 October 6, 2017 swing low
