- GBP/USD is on the rise as USD weakens across the board.
- The level to beat for bulls is 1.2700 resistance.
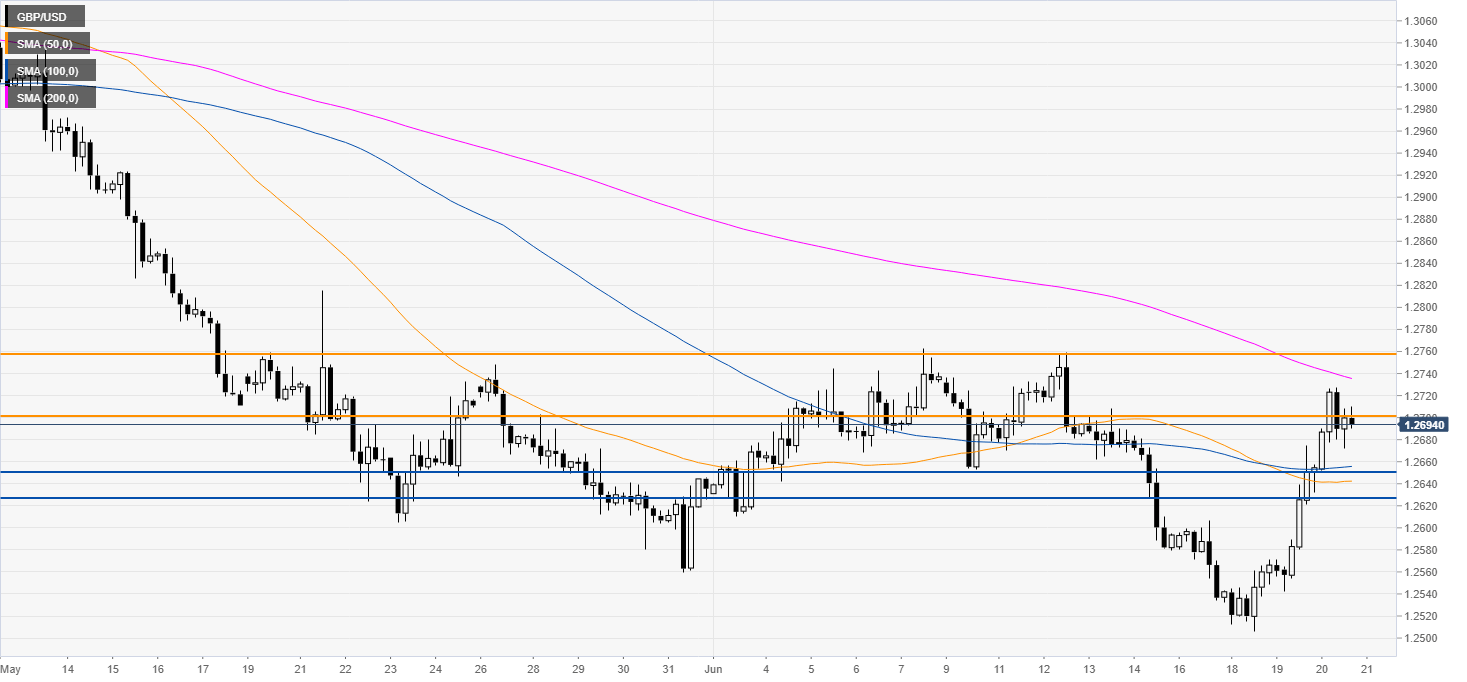
GBP/USD daily chart
GBP/USD is trading in a bear trend below its main simple moving averages. The market is rebounding from the 1.2500 handle.

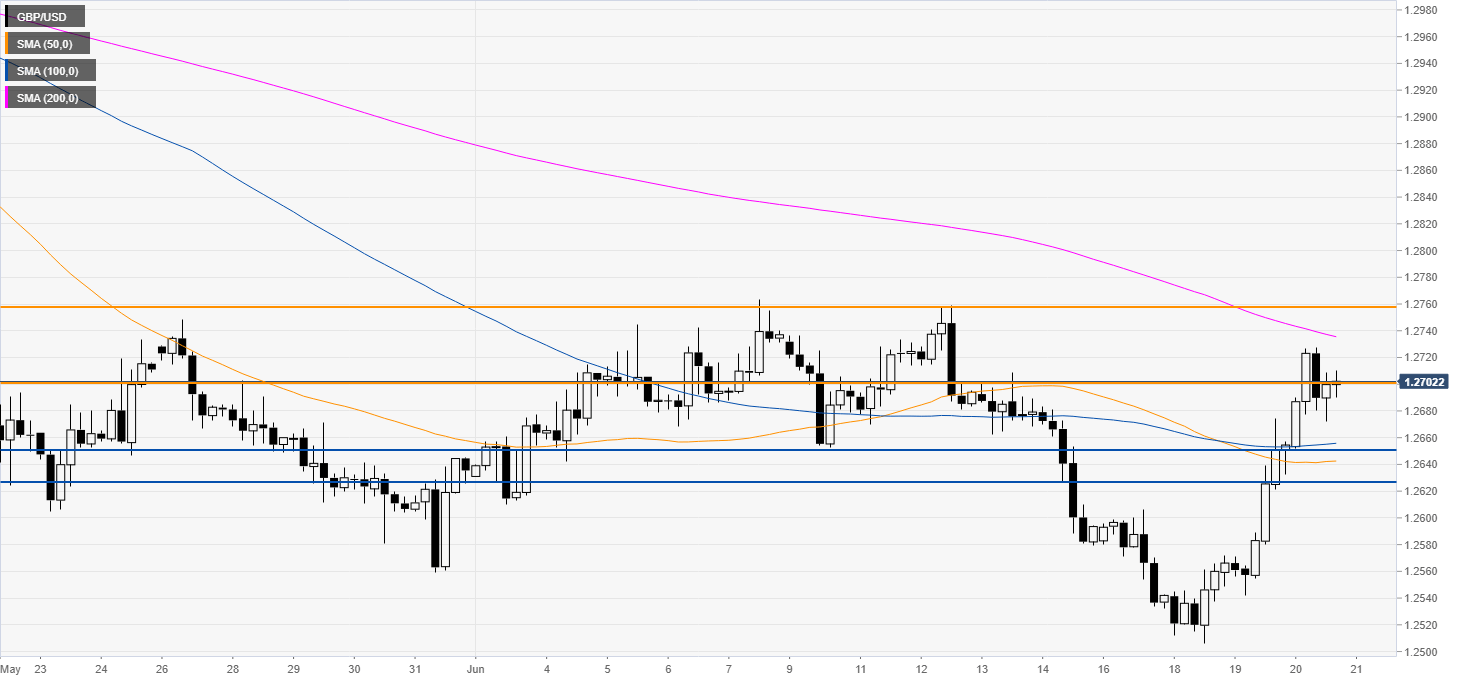
GBP/USD 4-hour chart
Cable rose sharply this Thursday and found tough resistance near 1.2700 figure. A daily close above that level would be encouraging for bulls to have a run towards 1.2759 (pivot point R2 and previous week high).
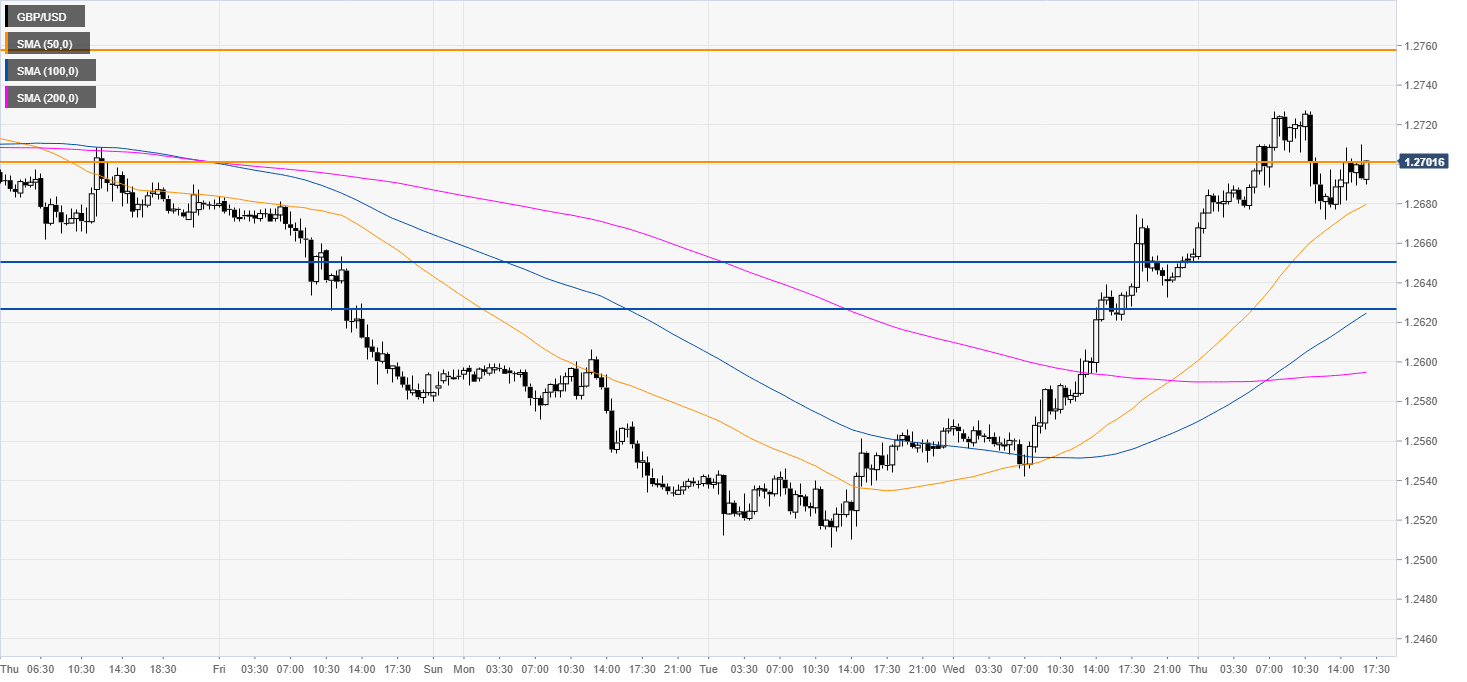
GBP/USD 30-minute chart
GBP/USD is trading above its main SMAs suggesting a bullish bias in the short term. The 1.2650 and 1.2627 levels are seen as strong support according to the Technical Confluences Indicator.
Additional key levels