- GBP/USD is trading flat this week around the 1.2300 handle.
- The level to beat for buyers is the 1.2330 resistance.
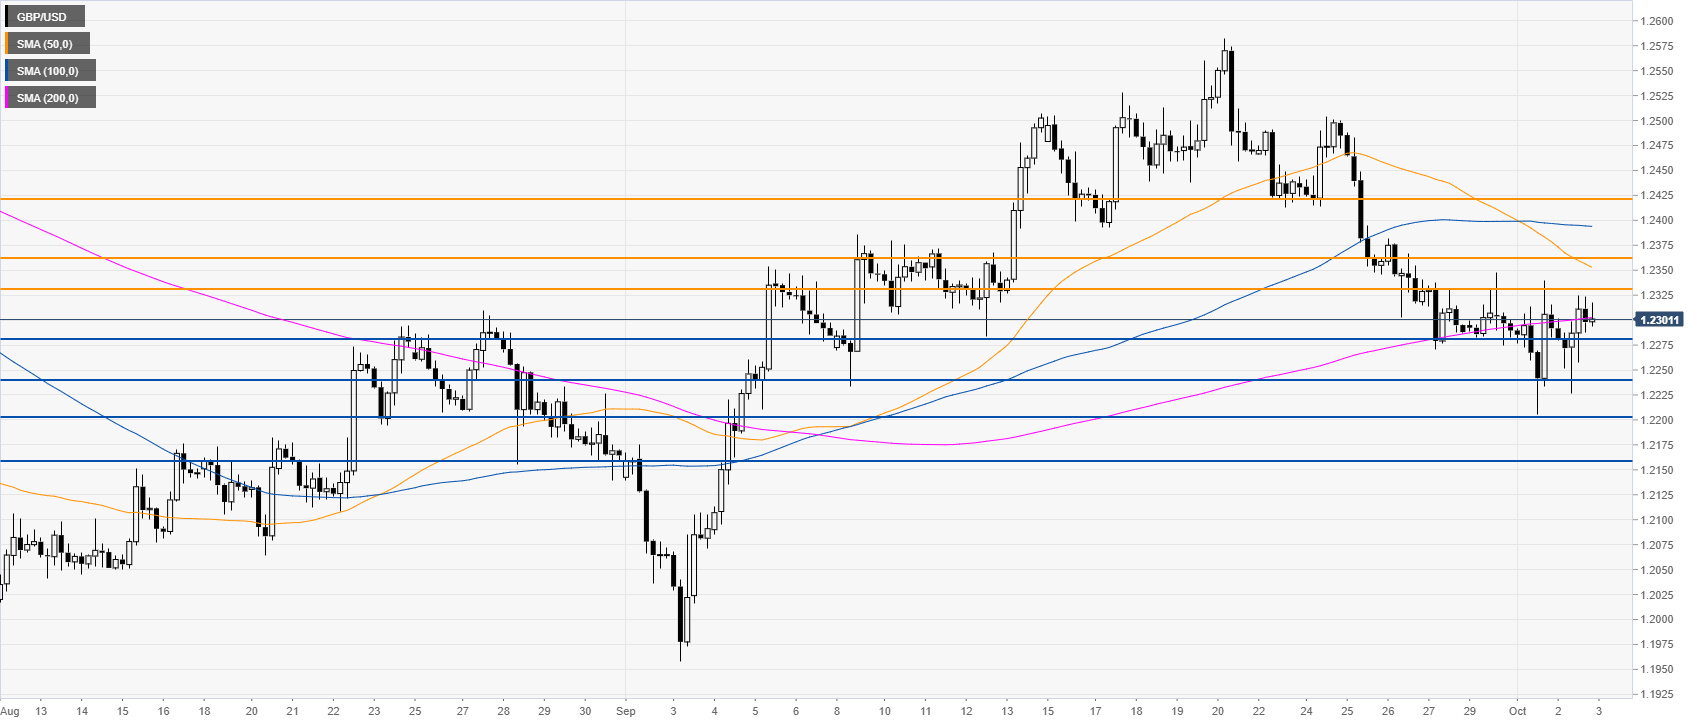
GBP/USD daily chart
The Sterling is trading in a bear trend below its 100 and 200-day simple moving averages (DSMAs). This Wednesday, the ADP, the forerunner of the Nonfarm Payrolls on Friday disappointed with only 135k vs. 140k expected in September. PM Johnson gave a Brexit plan that the DUP supports. This helped GBP/USD to stabilize around the 1.2300 figure.

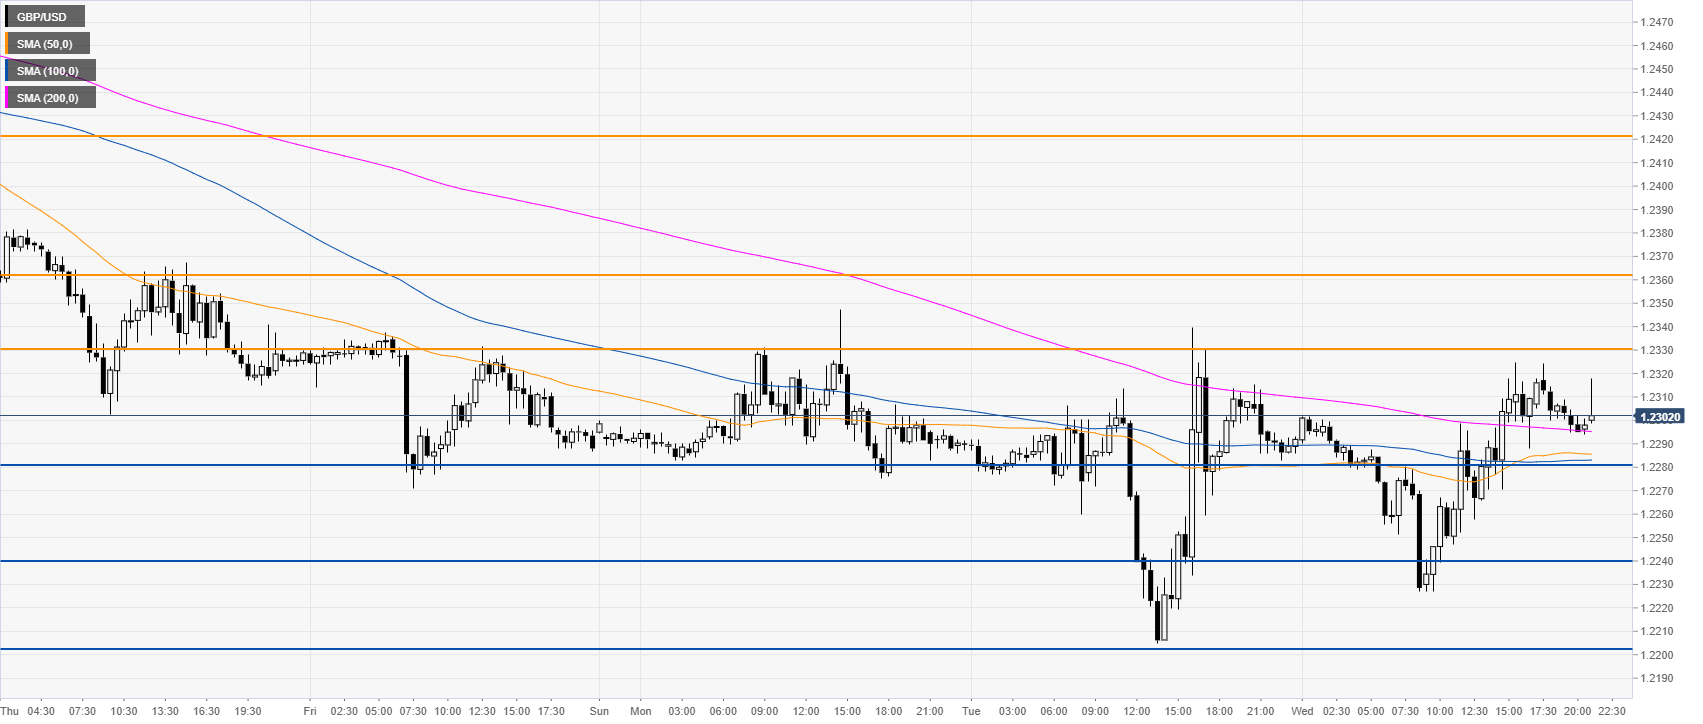
GBP/USD four-hour chart
GBP/USD is coiling around the 200 SMA, suggesting a neutral bias in the medium term. A break below the 1.2200 level would expose the 1.2157 support, according to the Technical Confluences Indicator.
GBP/USD 30-minute
The Pound/US Dollar exchange rate is trading above the main SMAs on the 30-minute chart, suggesting a bullish bias in the short term. A break above 1.2330 can lead to the 1.2360 and 1.2420 resistance if the bulls gather enough steam. Immediate supports are seen at the 1.2280 and 1.2240 levels, according to the Technical Confluences Indicator.
Additional key levels
