- GBP/USD main bear trend has been on hold since mid-August as bulls were able to bring Cable above the 50-day simple moving average. The US Federal Reserve Bank raised rates by 25 bps matching consensus. GBP/USD rose above 1.3200 but quickly fell and entered a 60-pip range.
- GBP/USD is still trading above its 50, 100 and 200-period simple moving averages suggesting a bullish bias. The RSI and MACD indicators are bullishly configured while the Stochastics is dropping from overbought territory.
- Resistance to the upside can be seen near 1.3200, 1.3300 figure and 1.3363 July high.
GBP/USD 4-hour chart
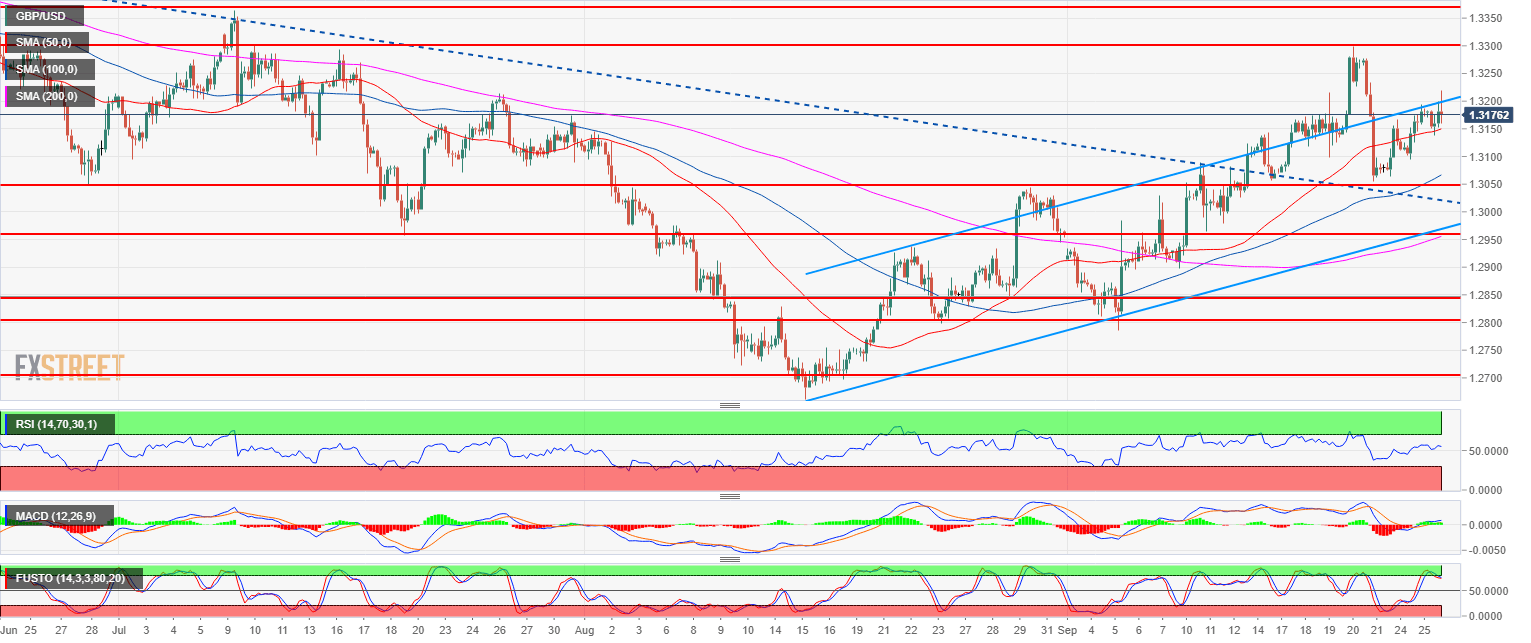
Spot rate: 1.3180
Relative change: 0.00%
High: 1.3218
Low: 1.3138
Main trend: Bullish
Resistance 1: 1.3200 figure (key support/resistance)
Resistance 2: 1.3300 figure
Resistance 3: 1.3363 July high
Resistance 4: 1.3472 June 7 high
Support 1: 1.3144 key level
Support 2: 1.3100 figure
Support 3: 1.3050 August 30 swing high, key level
Support 4: 1.3000 figure
Support 5: 1.2957 July 19 swing low
