- GBP/USD starts the week trading within familiar ranges around the 1.2300 handle.
- The level to beat for sellers is the 1.2275 support.
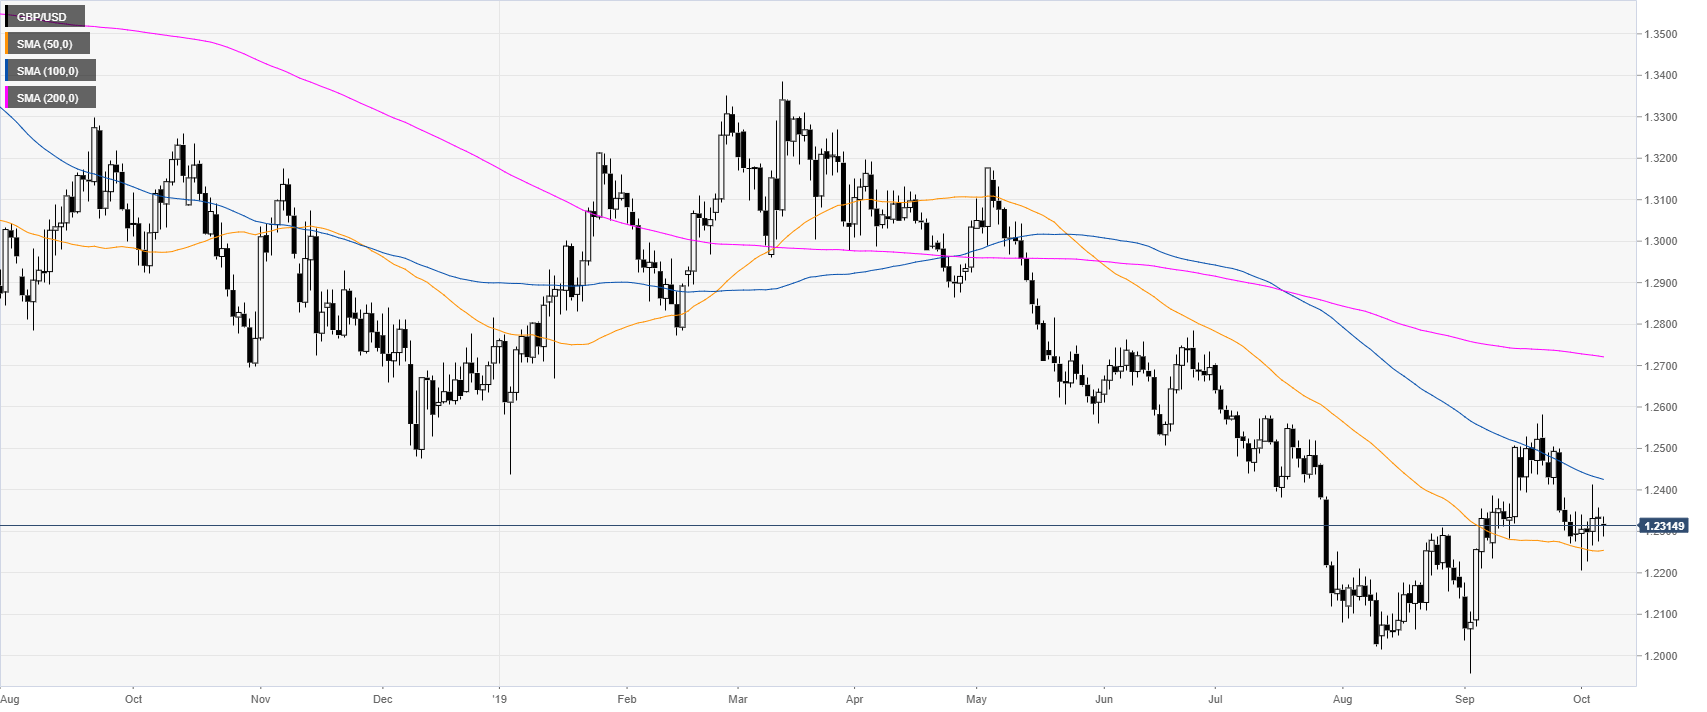
GBP/USD daily chart
On the daily time-frame, the Sterling is trading in a bear trend below the 100 and 200-day simple moving averages (DSMAs). The market remains trapped between the 50 SMA at 1.2254 and the 1.2400 figure.
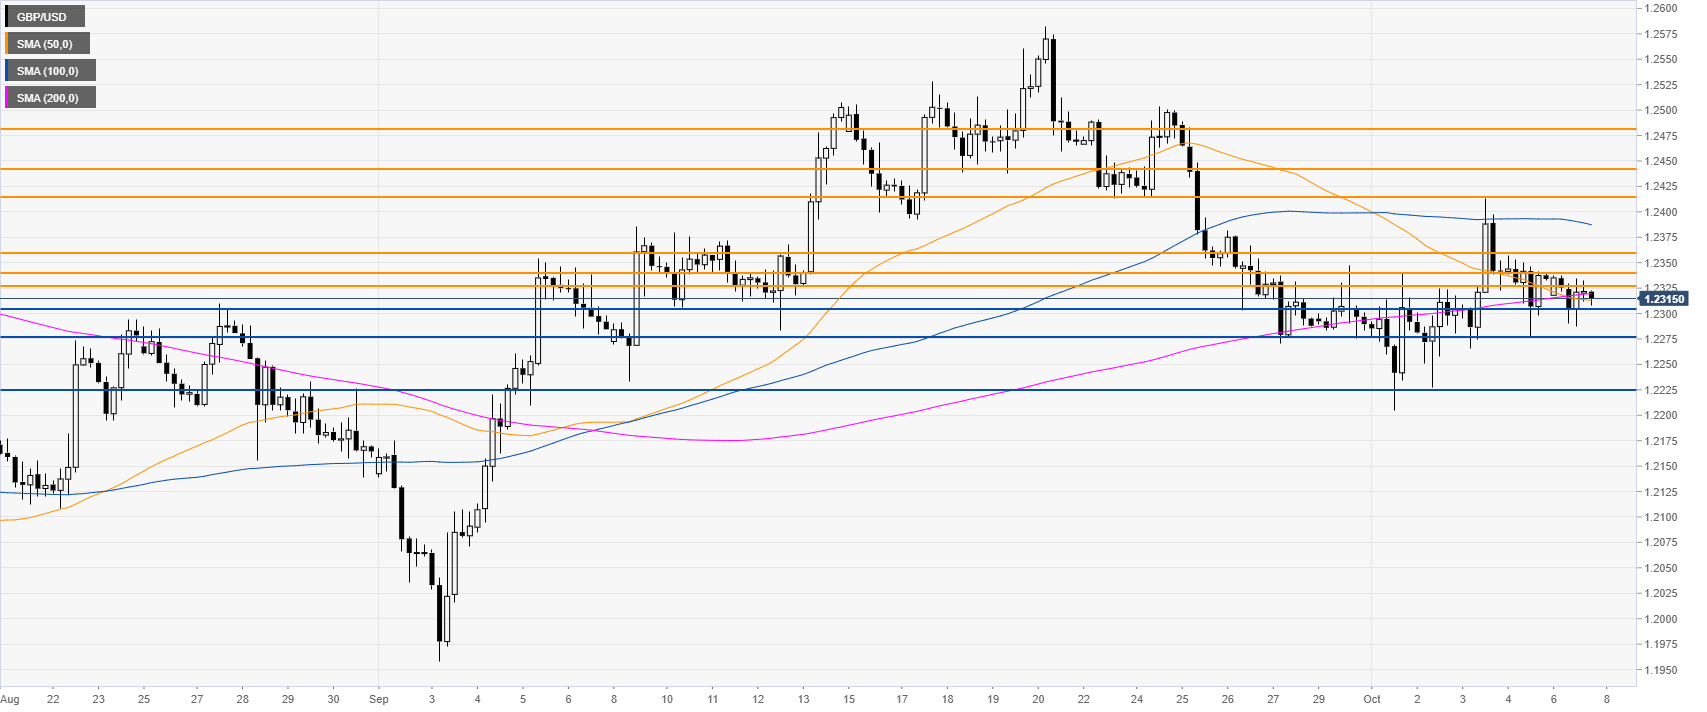
GBP/USD four-hour chart
GBP/USD is trading close to the 50 and 200 SMA, while the spot is in a tight trading range. Bears would need a break below the 1.2305/1.2275 support zone to drive the market towards 1.2224 support level, according to the Technical Confluences Indicator.
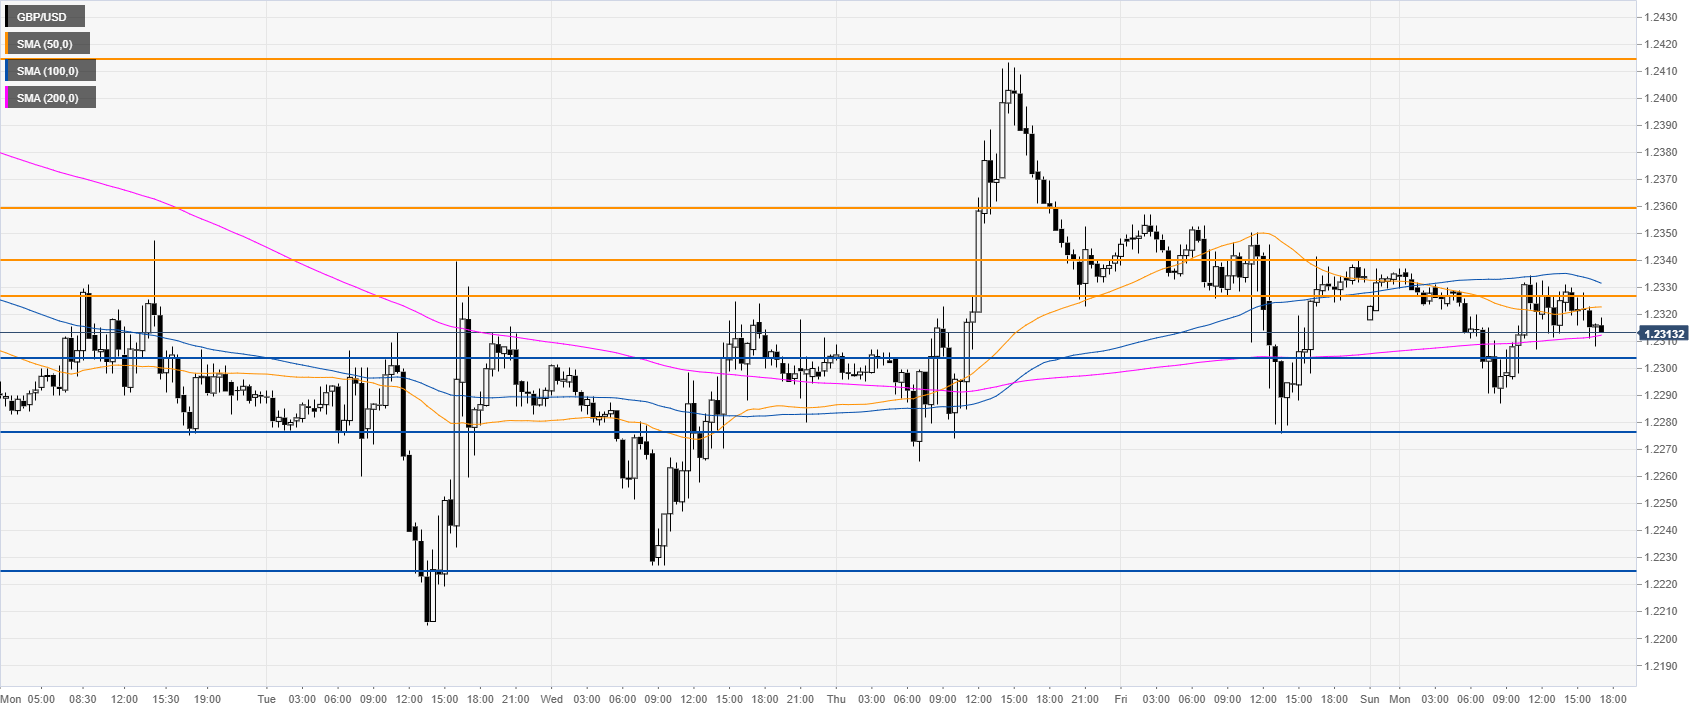
GBP/USD 30-minute
The Sterling is trading within the range of the last two trading days. Immediate resistances are seen at the 1.2326 and 1.2340/60 levels. Further up lie 1.2412 resistance, according to the Technical Confluences Indicator.
Additional key levels
