- GBP/USD got a push to the upside just before the London close this Thursday.
- A daily close above 1.2874 could strengthen the bullish side.
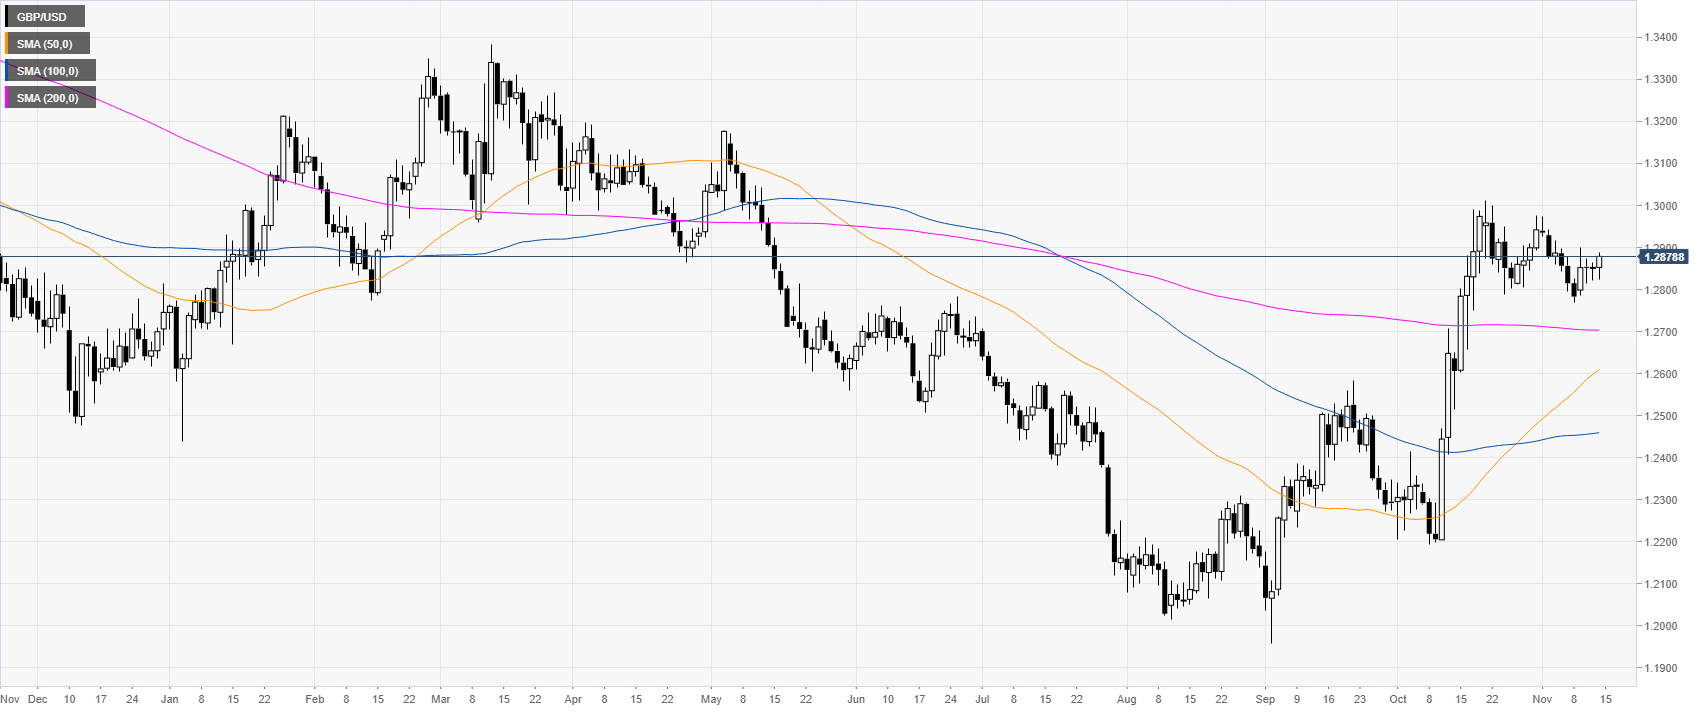
GBP/USD daily chart
The pound is currently correcting the October’s rally in the 1.2800-1.3000 price zone. GBP/USD, in last month, reached levels not seen since mid-May 2019.
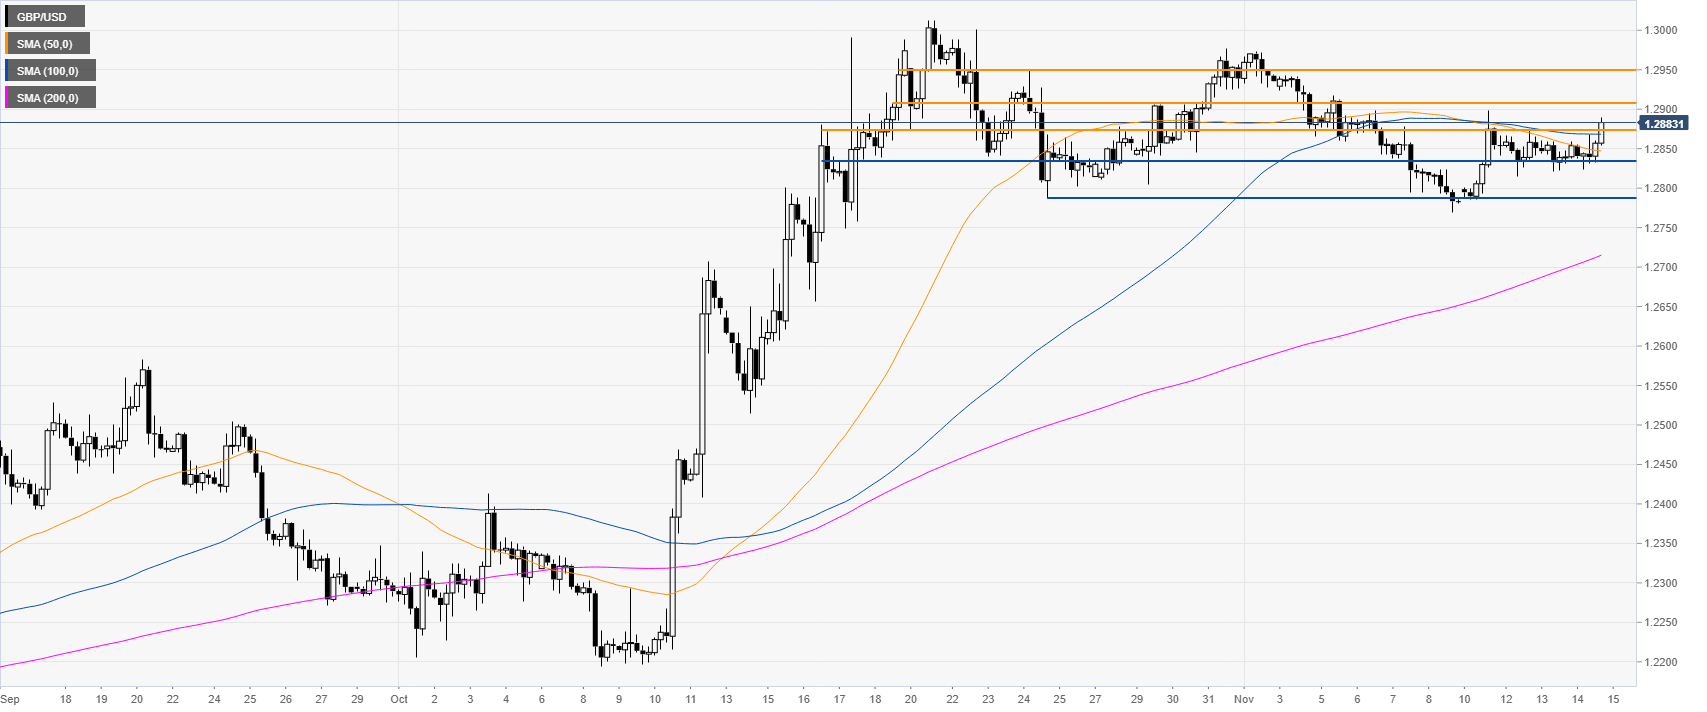
GBP/USD four-hour chart
GBP/USD is trying to break above the 1.2874/1.2910 resistance zone. The spot is trading above the 50 and 100 SMAs, suggesting that bulls are gaining ground. If the market breaks the 1.2910 resistance, the spot could reach the 1.2950 level on the way up, according to the Technical Confluences Indicator.
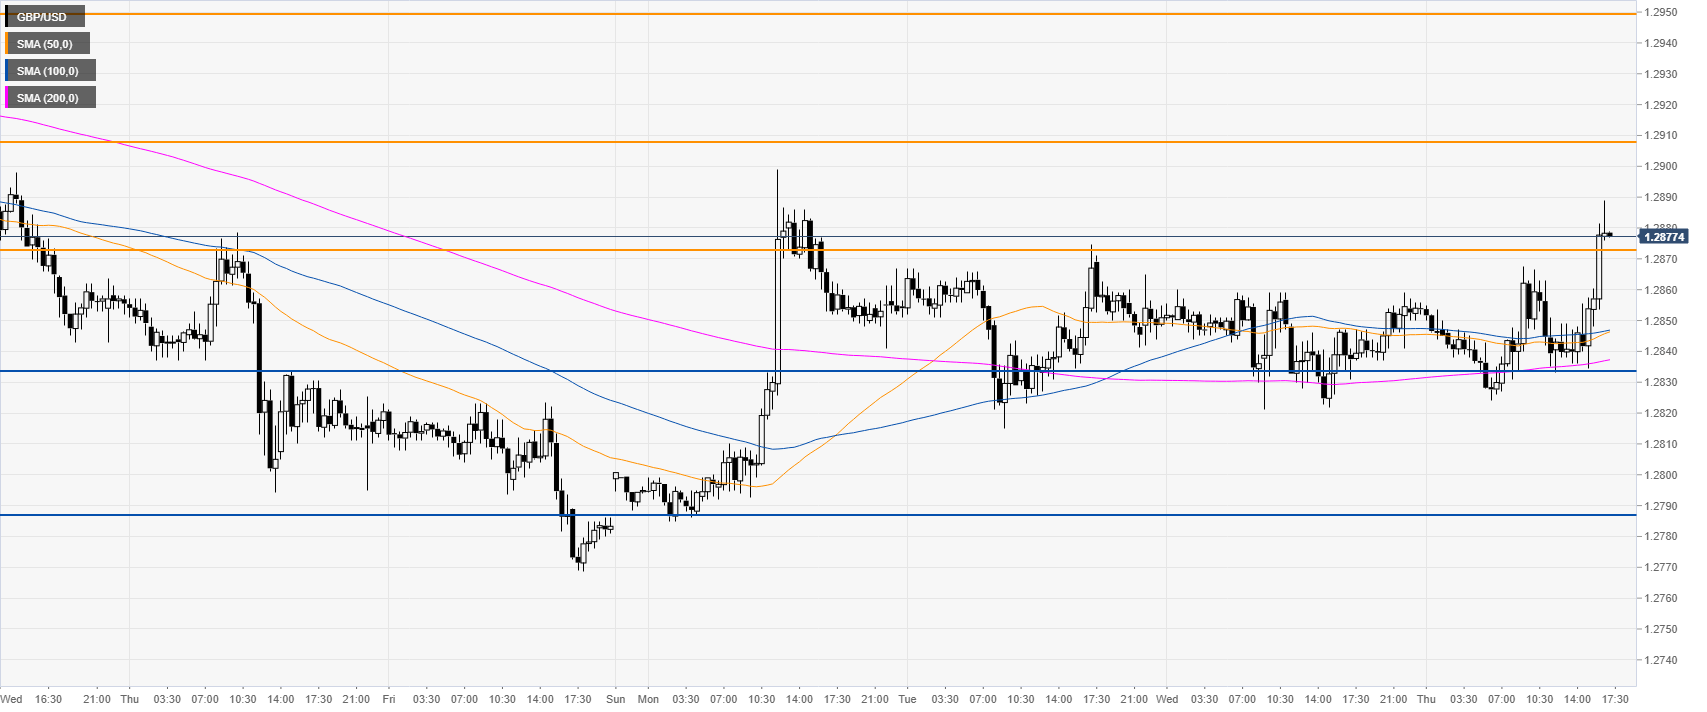
GBP/USD 30-minute chart
The market is trading within is weekly range. However, if the market manages to stay above the 1.2874 level, it can strengthen the bull case. Support is seen at the 1.2834 level.
Additional key levels
