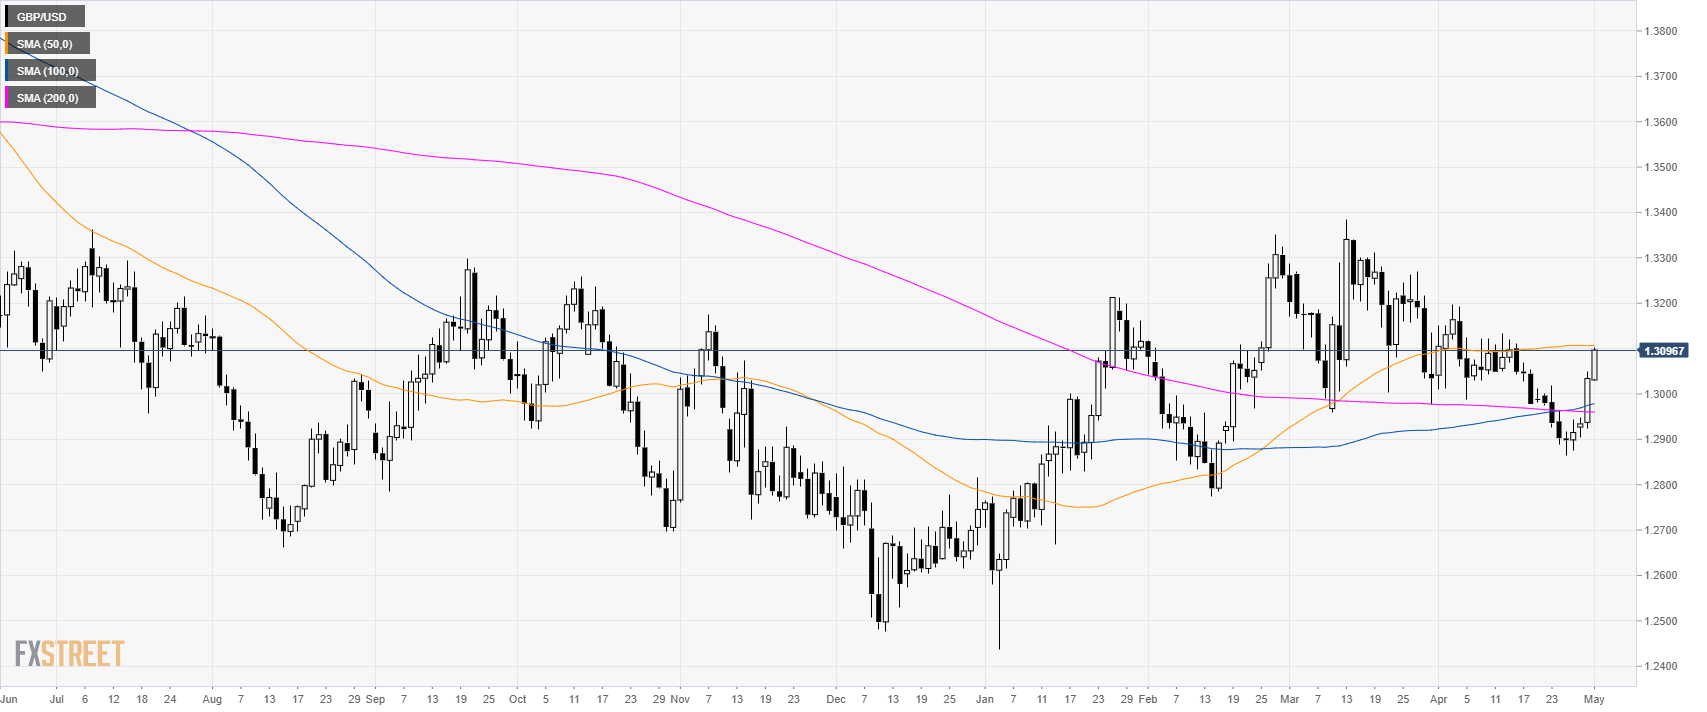
GBP/USD daily chart
- GBP/USD is trading above its 100 and 200 SMAs as the market is testing the 1.3100 figure and the 50 SMA.
- The Federal Reserve Monetary Policy Statement was seen as dovish weakening the USD across the boards.
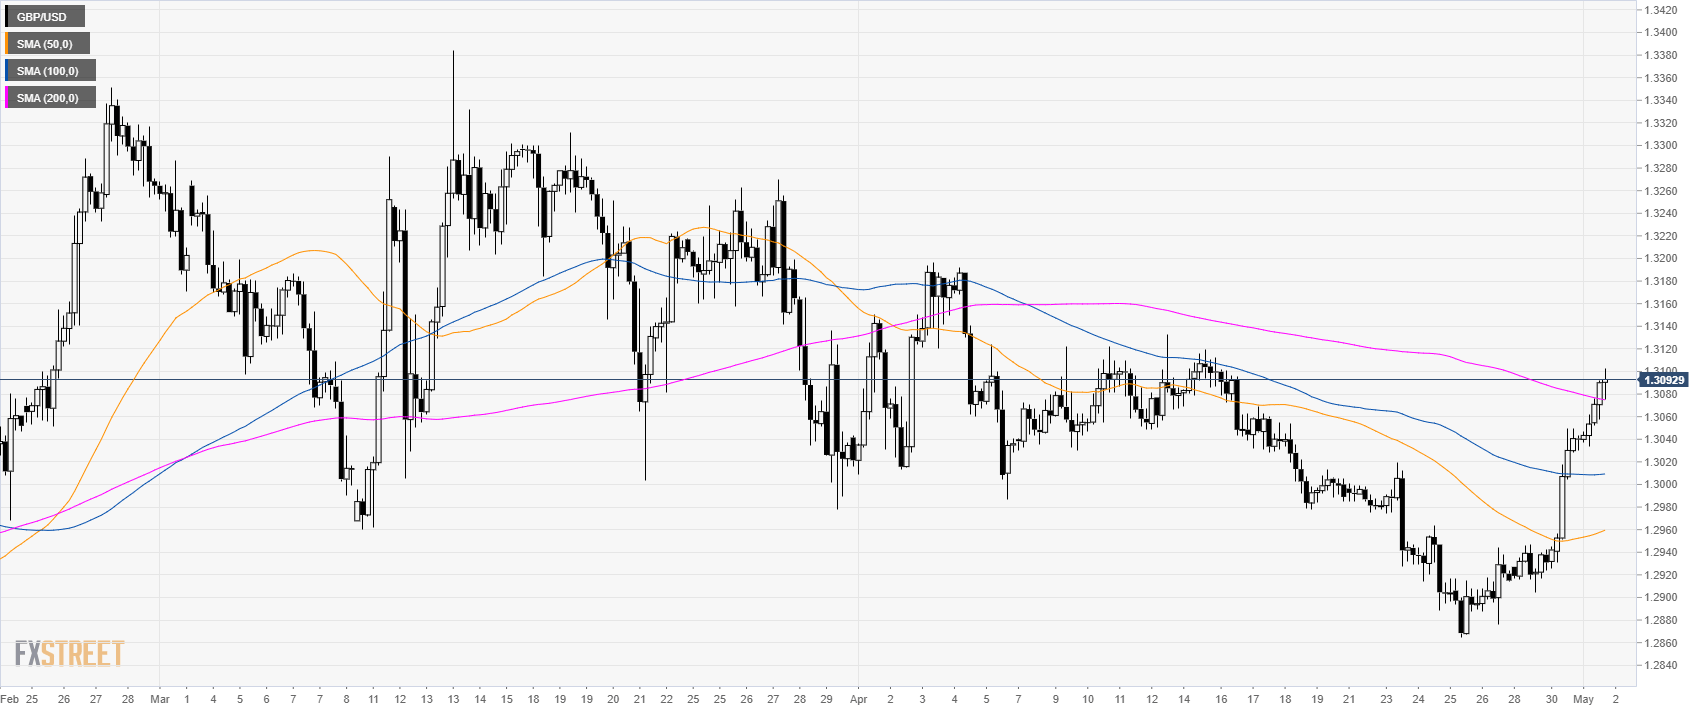
GBP/USD 4-hour chart
- GBP/USD is trading above its main SMAs suggesting bullish momentum in the medium-term.
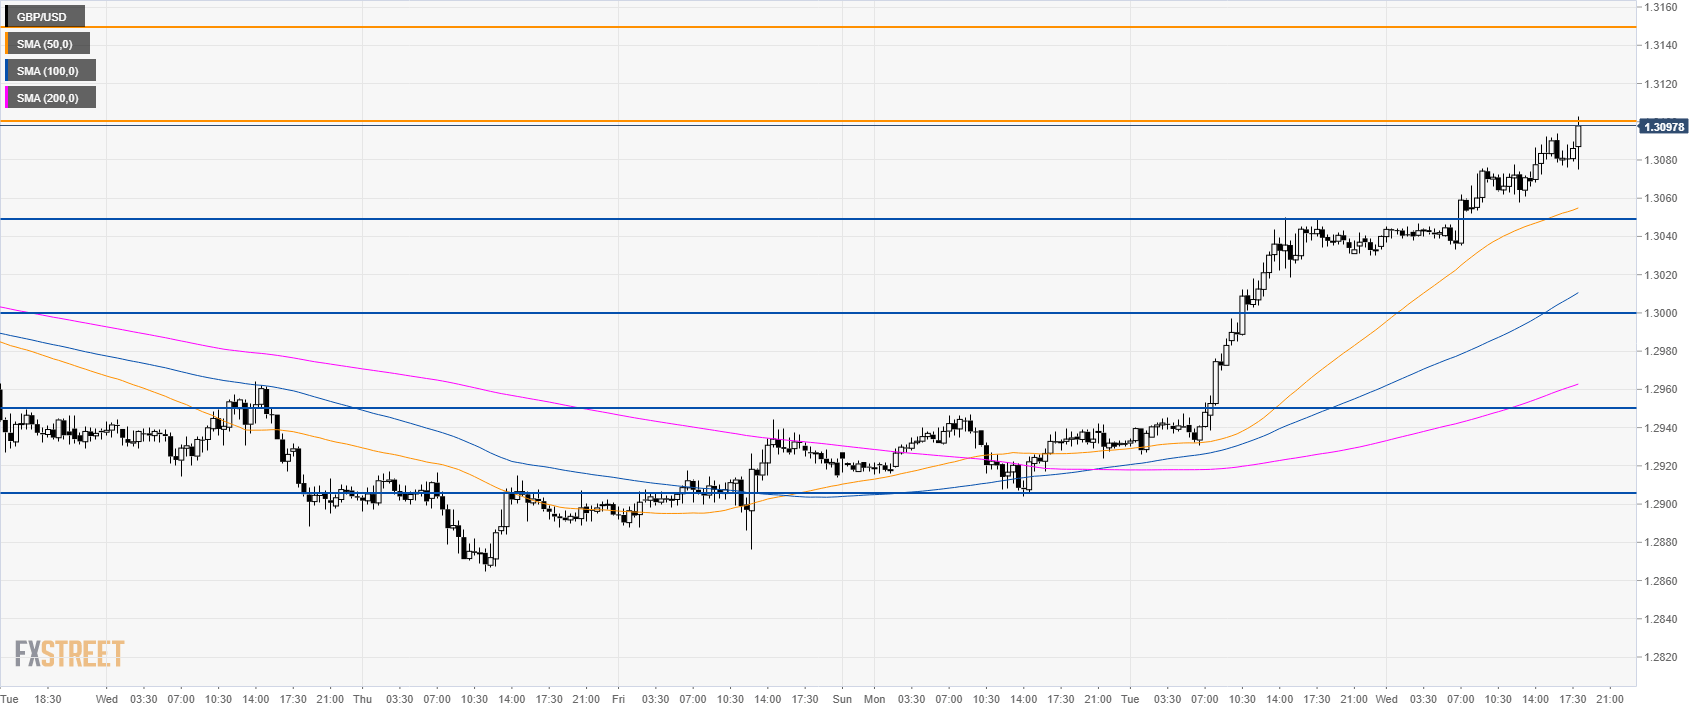
GBP/USD 30-minute chart
- GBP/USD is trading above its main SMAs suggesting a bullish bias in the short-term.
- Bulls are challenging 1.3100 figure. A break above the level seems imminent. 1.3150 should become the next target.
- On the way down, support is at 1.3050 and 1.3000 level.
Additional key levels
