- The Sterling/US Dollar currency pair is trading mixed this Friday.
- The level to beat for bears is the 1.2280 support level.
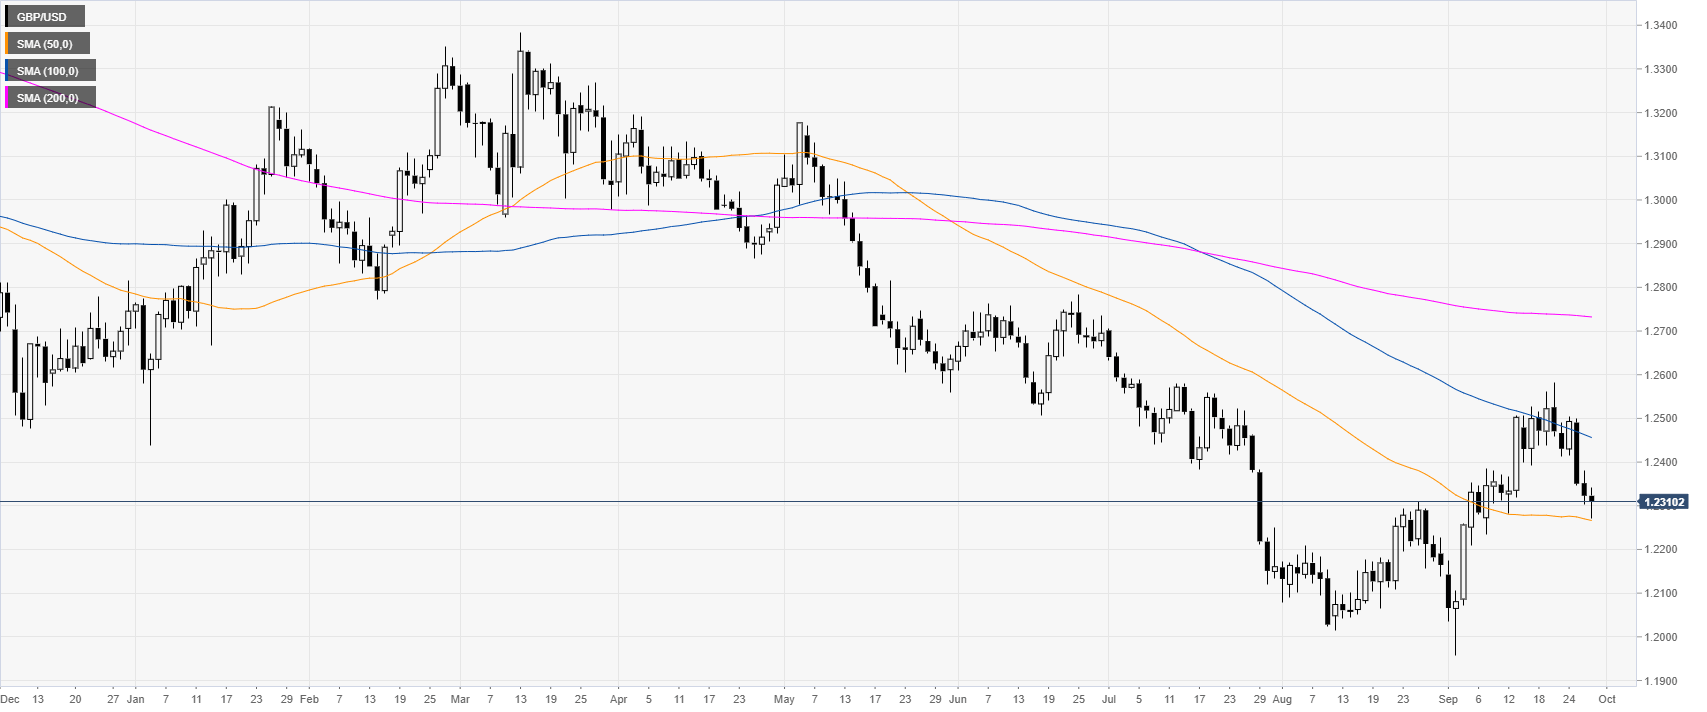
GBP/USD daily chart
The Sterling is trading in a downtrend below the 100 and 200-day simple moving averages (DSMAs). GBP/USD is hovering near the 1.2300 handle above the 50 SMA.
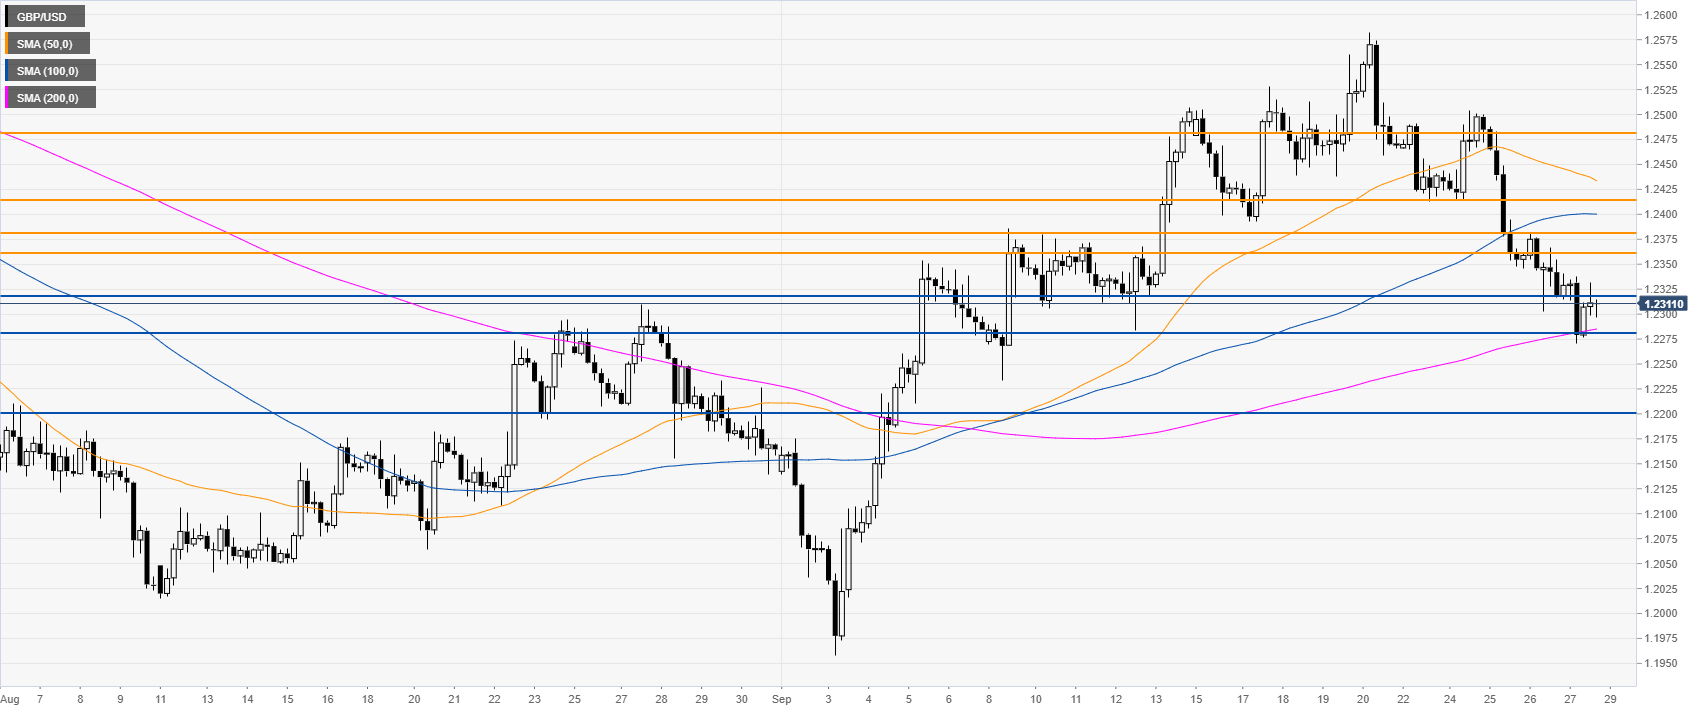
GBP/USD four-hour chart
GBP/USD is stabilizing near the 1.2300 handle and above the 200 SMA. A break below the 1.2280 can open the doors to the 1.2200 support level, according to the Technical Confluences Indicator.
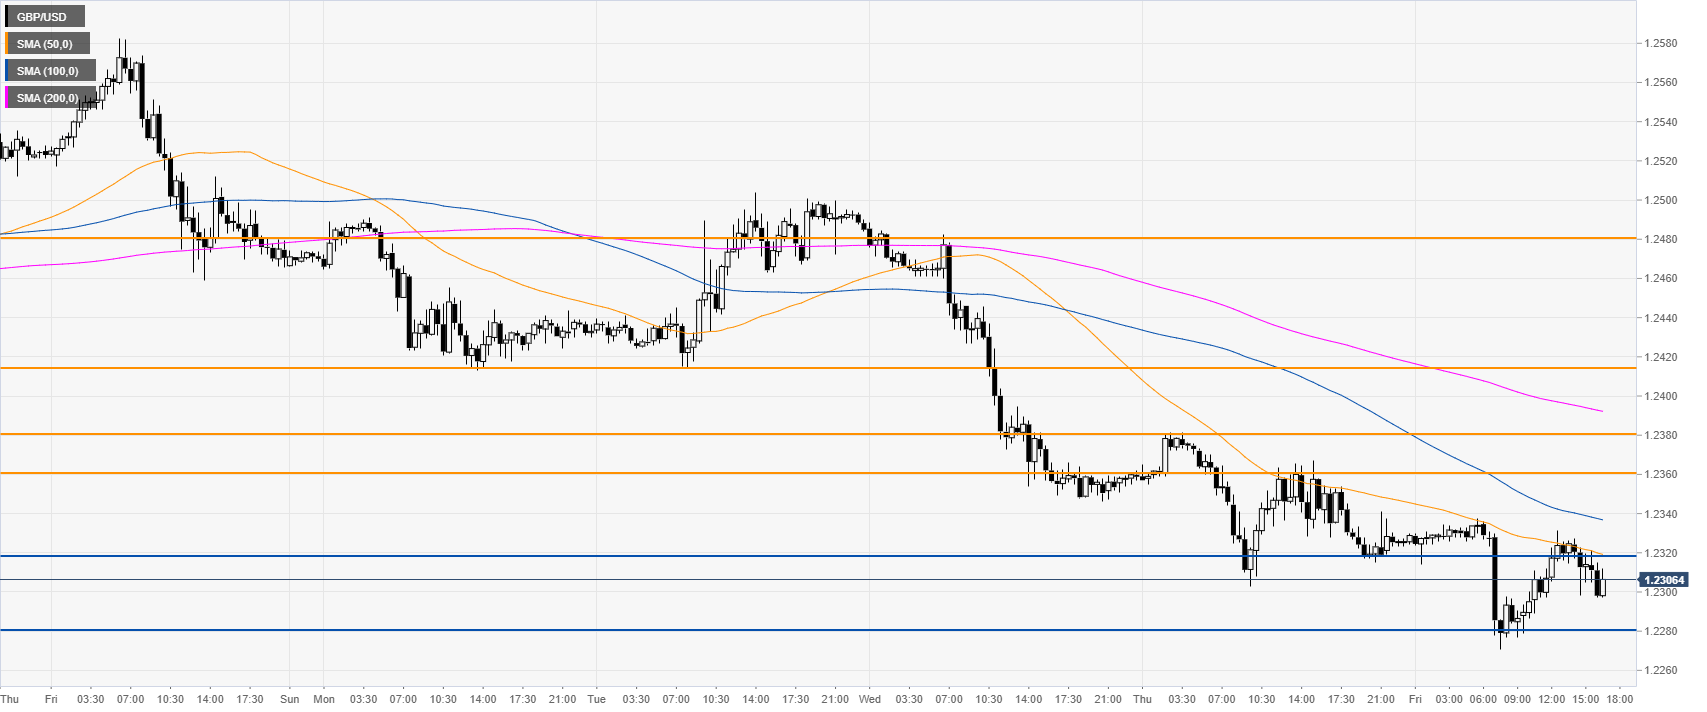
GBP/USD 30-minute
The Pound/US Dollar exchange is trading below its main SMAs on the 30-minute chart, suggesting a bearish bias in the short term. If the market closes above the 1.2320 level on Friday, it might prompt a bullish move towards 1.2360/80 resistance zone next week. If broken the next level is seen at 1.2415 on the way up.
Additional key levels
