Home GBP/USD Technical Analysis: Cable struggles to break above 1.3200 after reaching new 2018 low
FXStreet News

GBP/USD Technical Analysis: Cable struggles to break above 1.3200 after reaching new 2018 low

  • GBP/USD rejected the  1.3200 area after reaching 1.3146, the new 2018 low earlier in the European session.
  • GBP/USD has tested the 200-period simple moving average on the 15-minute chart suggesting subdued prices in the coming hours.
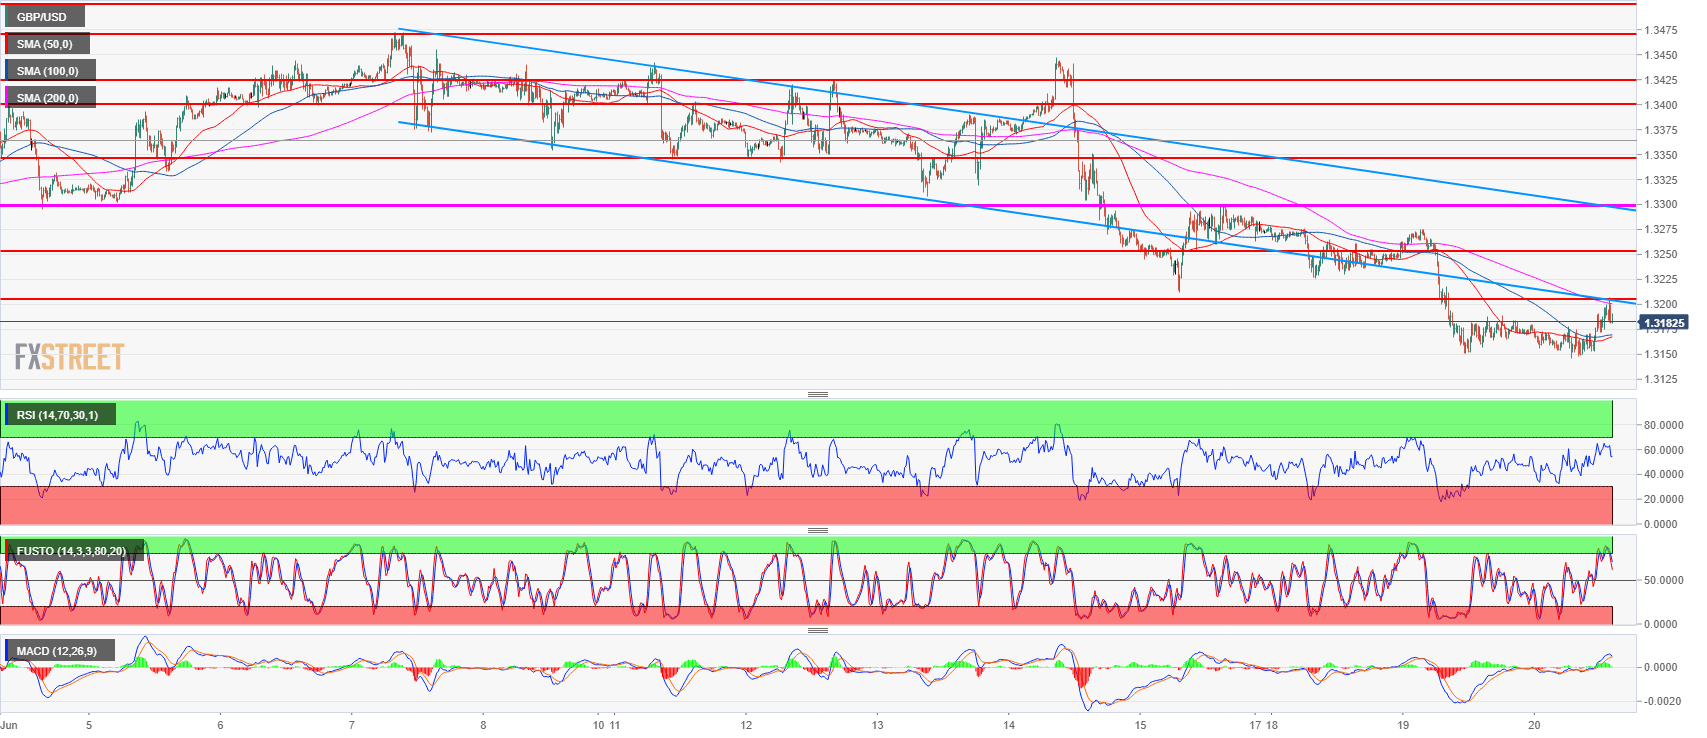
GBP/USD 15-minute chart

Spot rate:               1.3183
Relative change:     0.07%      
High:                      1.3206
Low:                       1.3146

Trend:                    Bearish

Resistance 1:        1.3200 figure
Resistance 2:         1.3250 figure    
Resistance 3:        1.3300 key support

Support 1:             1.3146, current 2018 low
Support 2:             1.3100 figure
Support 3:             1.3013 October 6, 2017 swing low

FX Street

FX Street

FXStreet is the leading independent portal dedicated to the Foreign Exchange (Forex) market. It was launched in 2000 and the portal has always been proud of their unyielding commitment to provide objective and unbiased information, to enable their users to take better and more confident decisions.