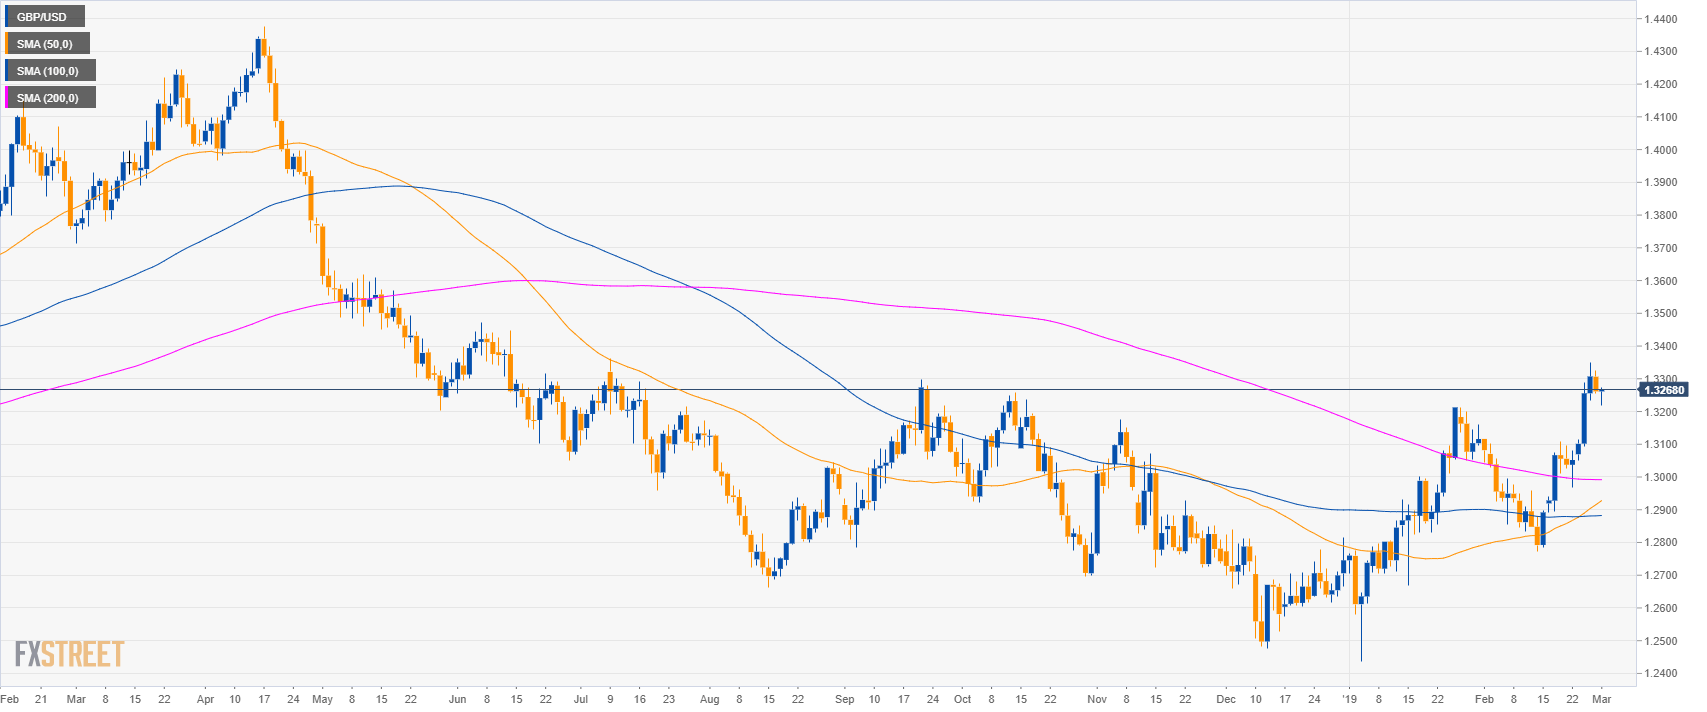
GBP/USD daily chart
- GBP/USD is trading in a bull trend above its main simple moving averages (SMAs).
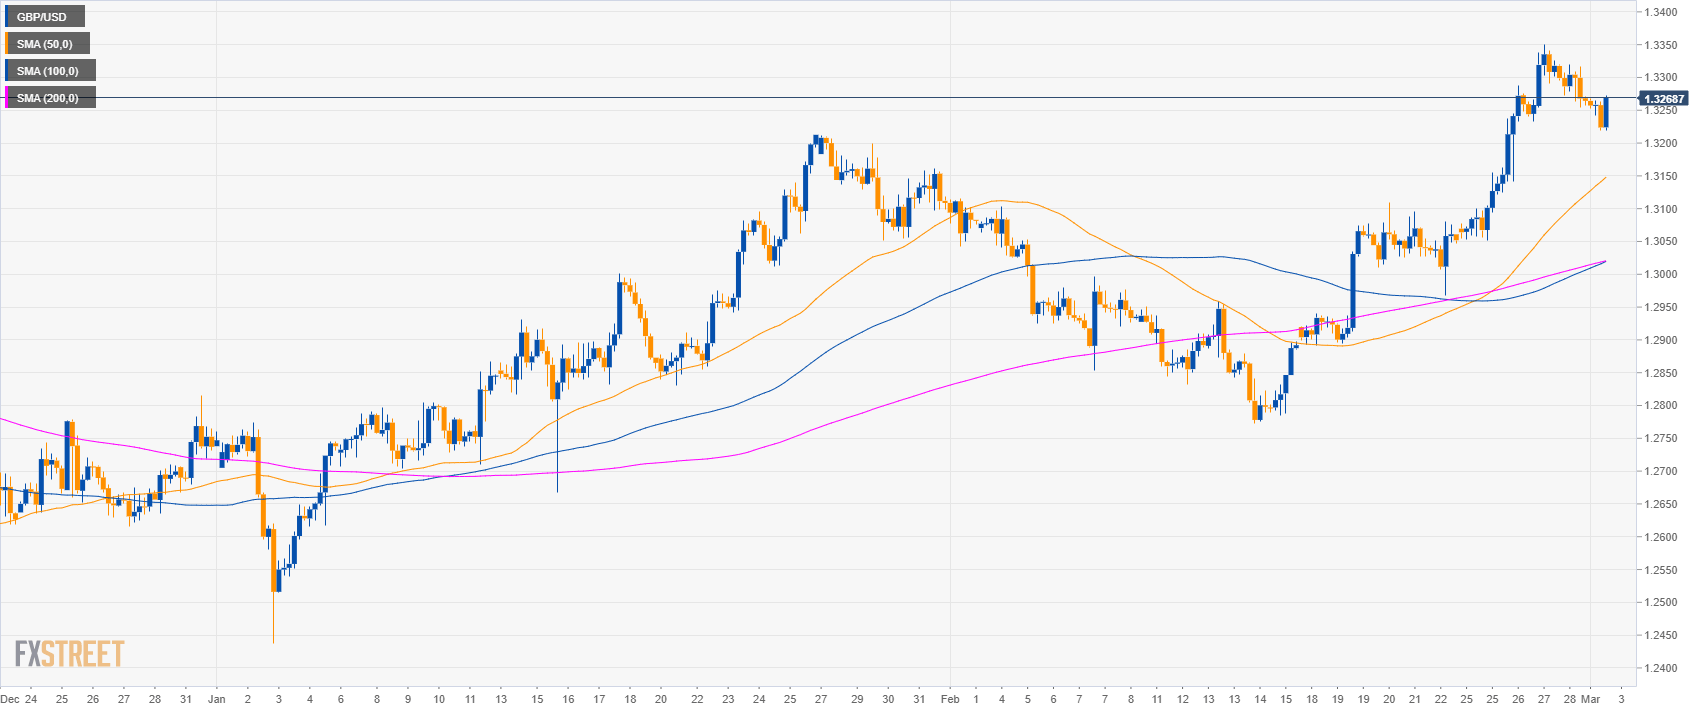
GBP/USD 4-hour chart
- GBP/USD is trading above its main SMAs suggesting bullish momentum in the medium-term.
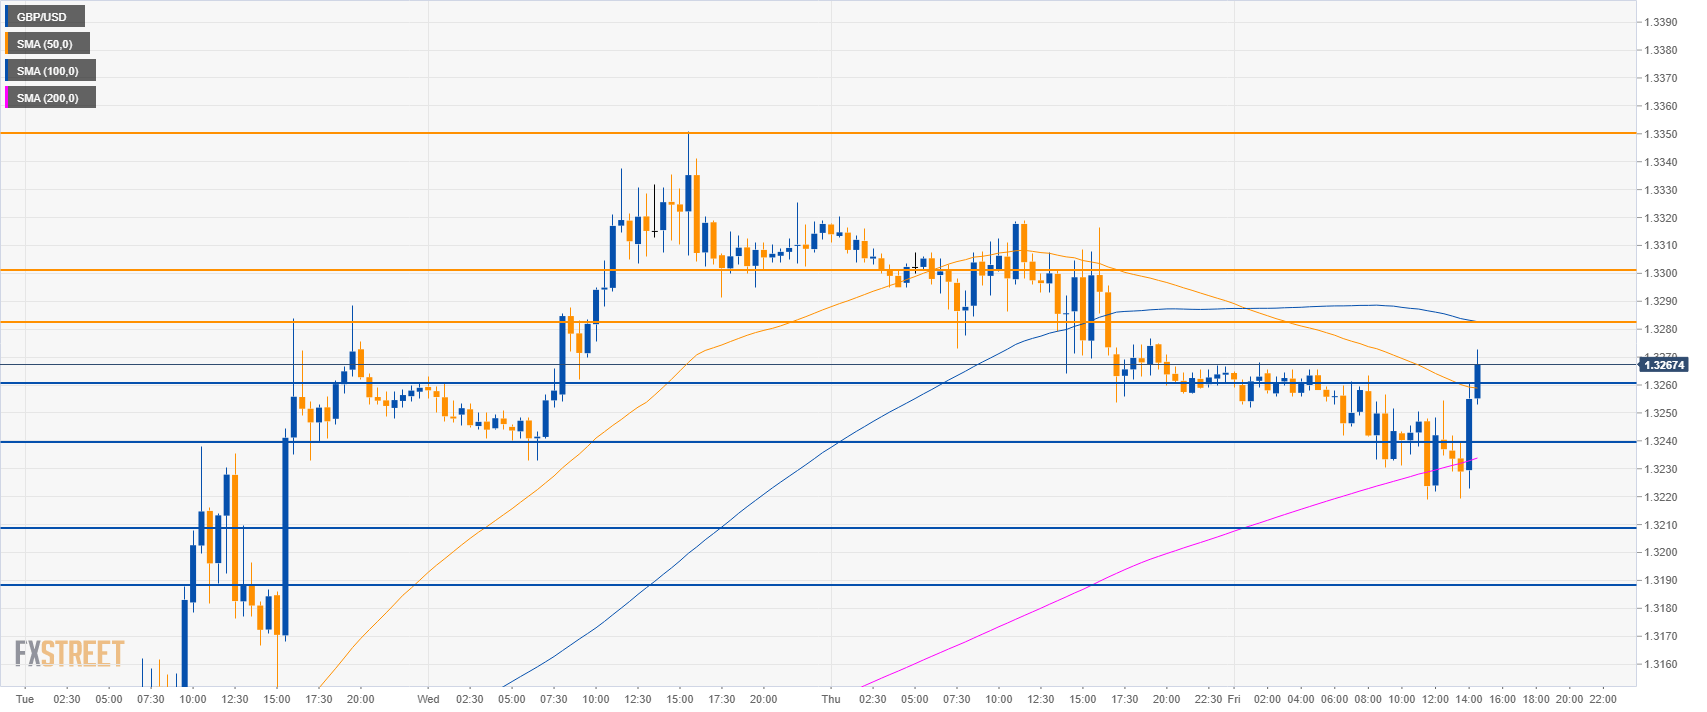
GBP/USD 30-minute chart
- GBP/USD is finding some support near 1.3220 suggesting a potential move up towards 1.3285 and 1.3300 figure. The 1.3350 is the level to beat for bulls in the longer-term.
- Support is at 1.3210 and 1.3190 level.
Additional key levels
GBP/USD
Overview:
Today Last Price: 1.3269
Today Daily change: 7 pips
Today Daily change %: 0.05%
Today Daily Open: 1.3262
Trends:
Daily SMA20: 1.3013
Daily SMA50: 1.2915
Daily SMA100: 1.2881
Daily SMA200: 1.2992
Levels:
Previous Daily High: 1.3325
Previous Daily Low: 1.3254
Previous Weekly High: 1.3109
Previous Weekly Low: 1.2891
Previous Monthly High: 1.3351
Previous Monthly Low: 1.2773
Daily Fibonacci 38.2%: 1.3281
Daily Fibonacci 61.8%: 1.3298
Daily Pivot Point S1: 1.3235
Daily Pivot Point S2: 1.3208
Daily Pivot Point S3: 1.3163
Daily Pivot Point R1: 1.3307
Daily Pivot Point R2: 1.3352
Daily Pivot Point R3: 1.3379
