- GBP/USD is bouncing from the 1.2400 level.
- Resistances are seen at 1.2440 and 1.248, according to the Technical Confluences Indicator.
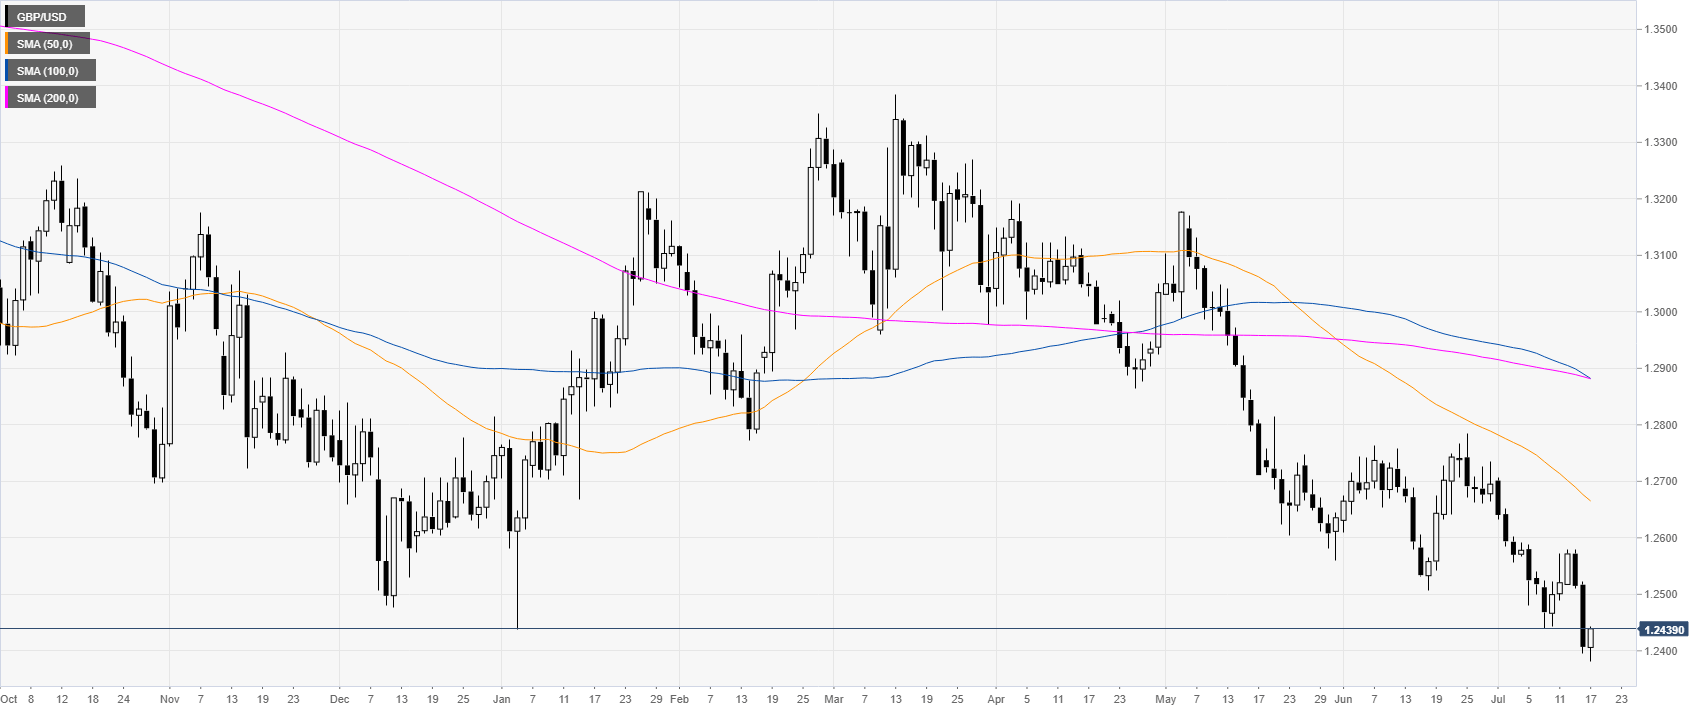
GBP/USD daily chart
GBP/USD is trading at 27-month lows as the market is having a small rebound above the 1.2400 figure.
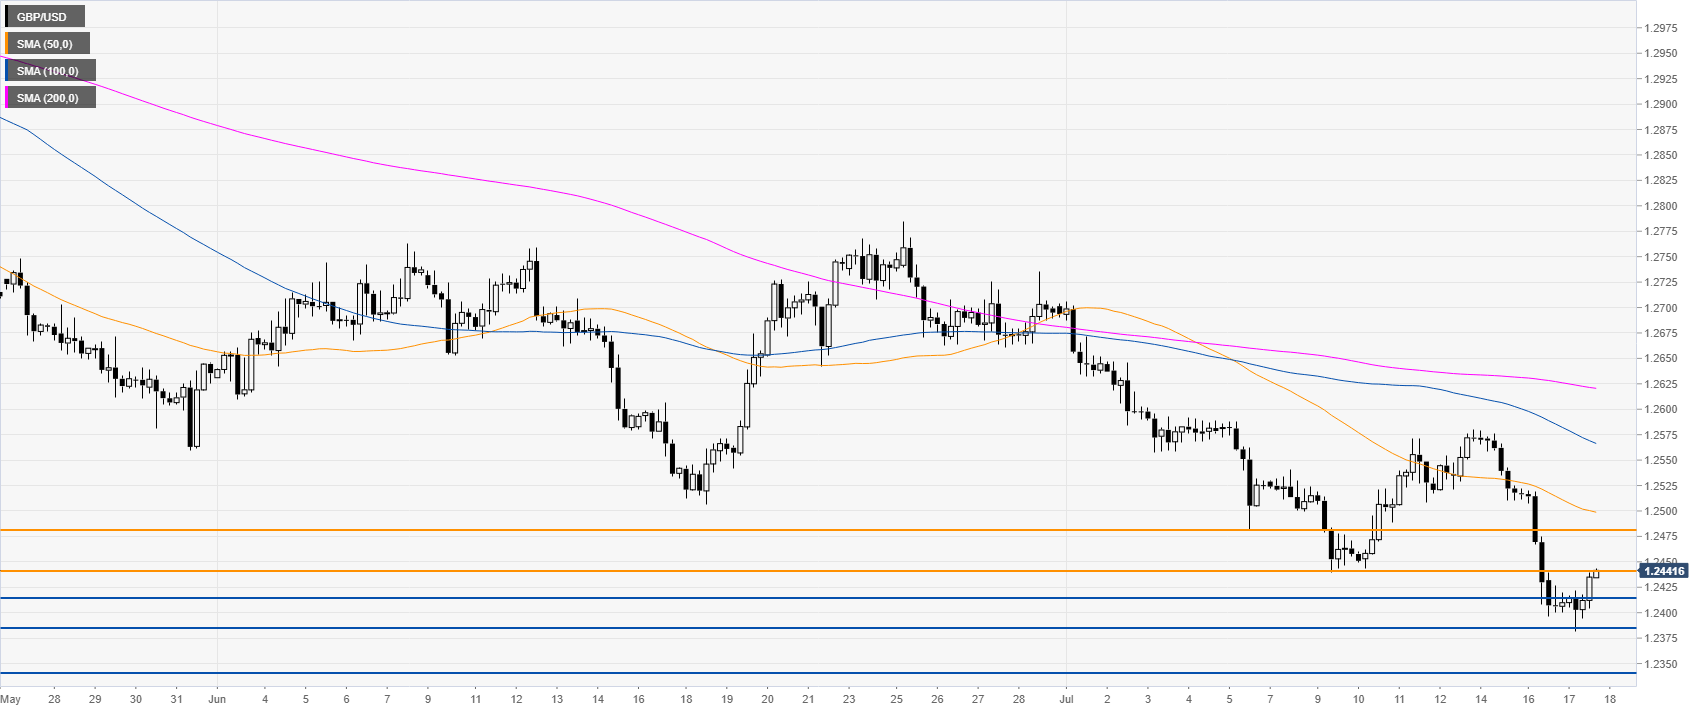
GBP/USD 4-hour chart
Cable is challenging the 1.2440 resistance. If bulls manage to break above 1.2440 the next resistance can be seen at 1.2480, according to the Technical Confluences Indicator.
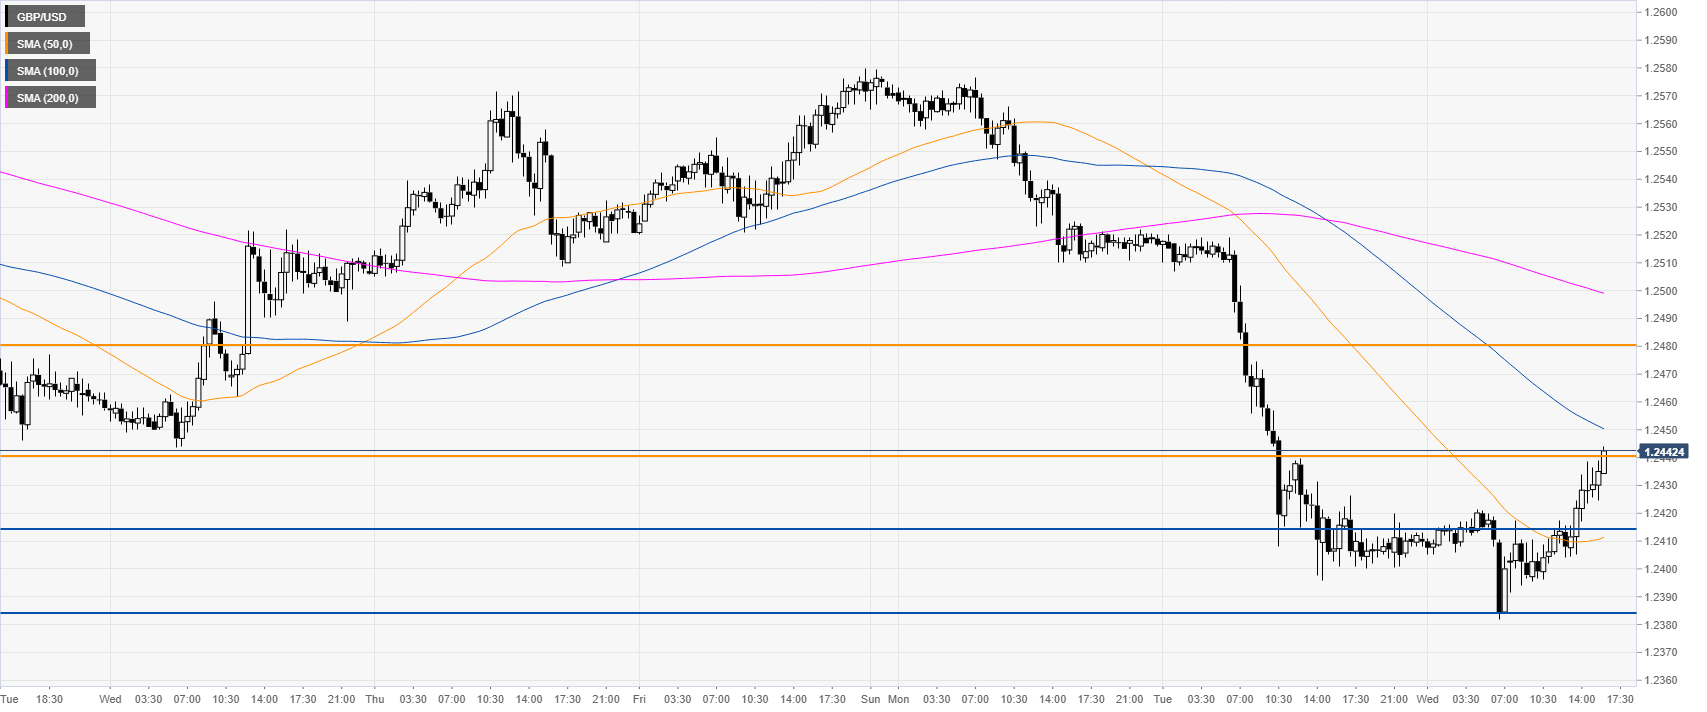
GBP/USD 30-minute chart
GBP/USD is trading between the 50 and 100 SMAs suggesting a correction in the medium term. Supports can be seen near 1.2414 and 1.2385

Additional key levels