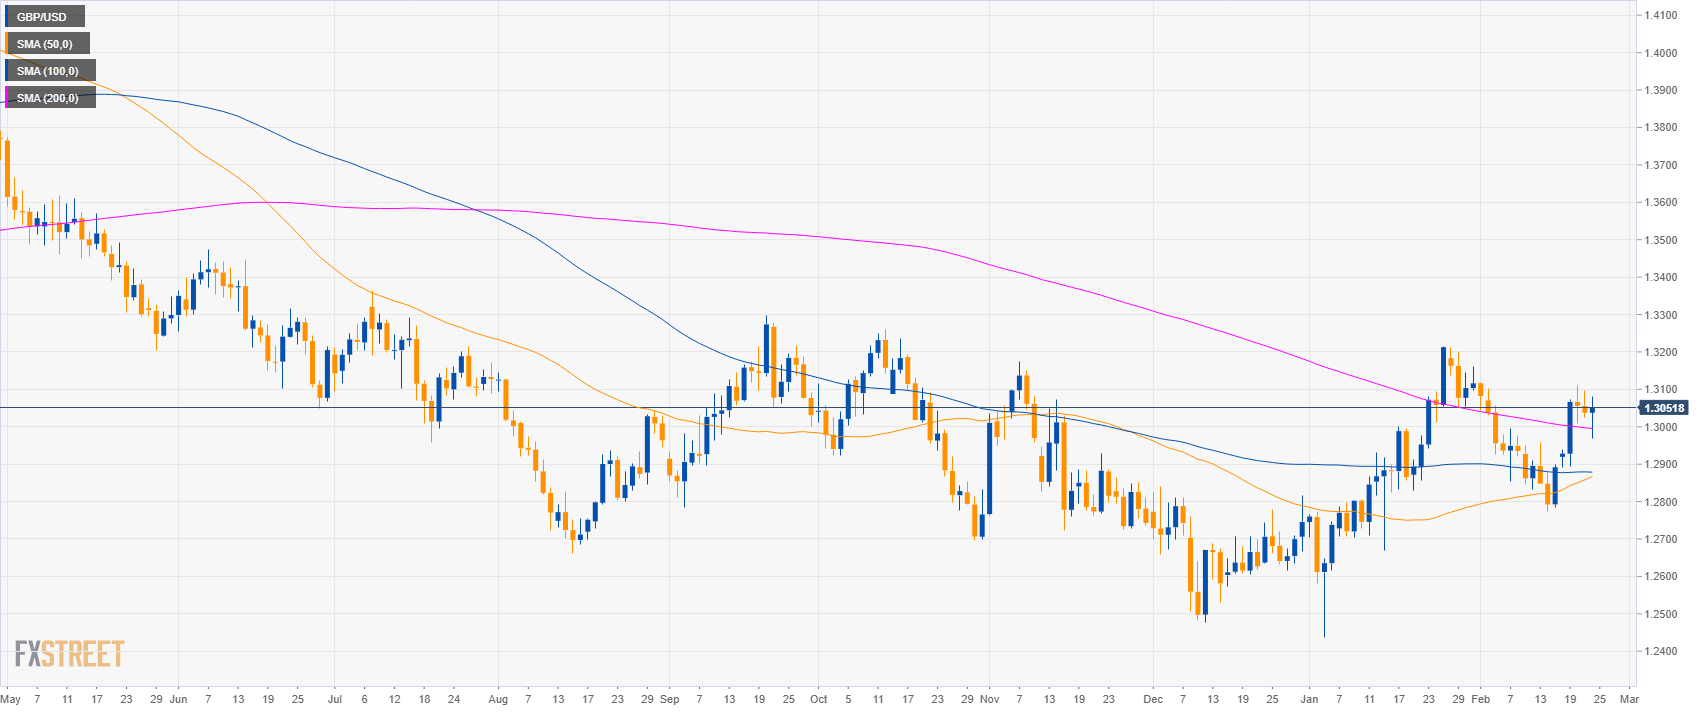
GBP/USD daily chart
- GBP/USD is trading above the main simple moving averages (SMAs).
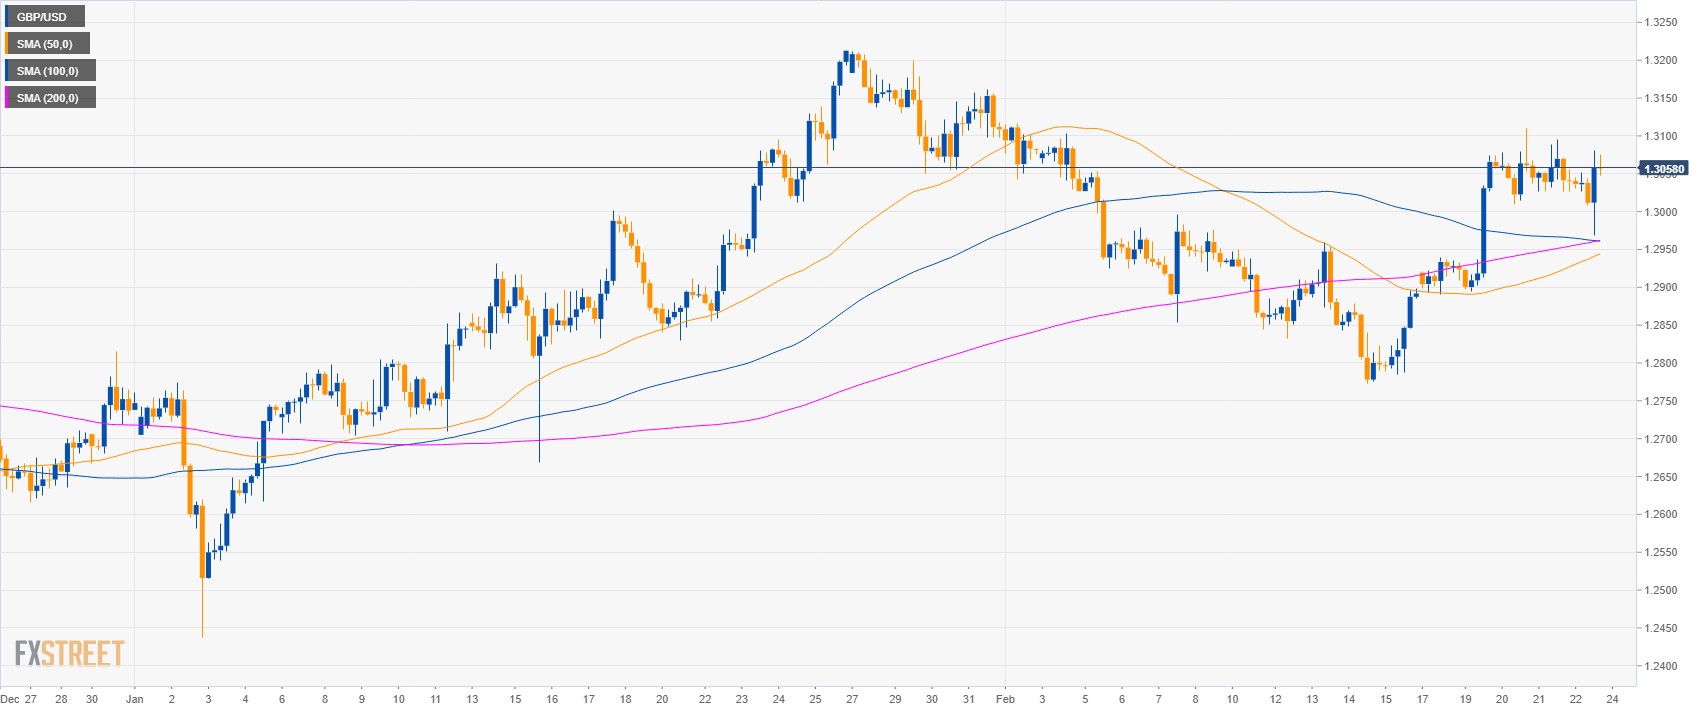
GBP/USD 4-hour chart
- GBP/USD is trading above the 1.3000 figure and the main simple moving averages (SMA) suggesting a bullish bias in the medium-term.
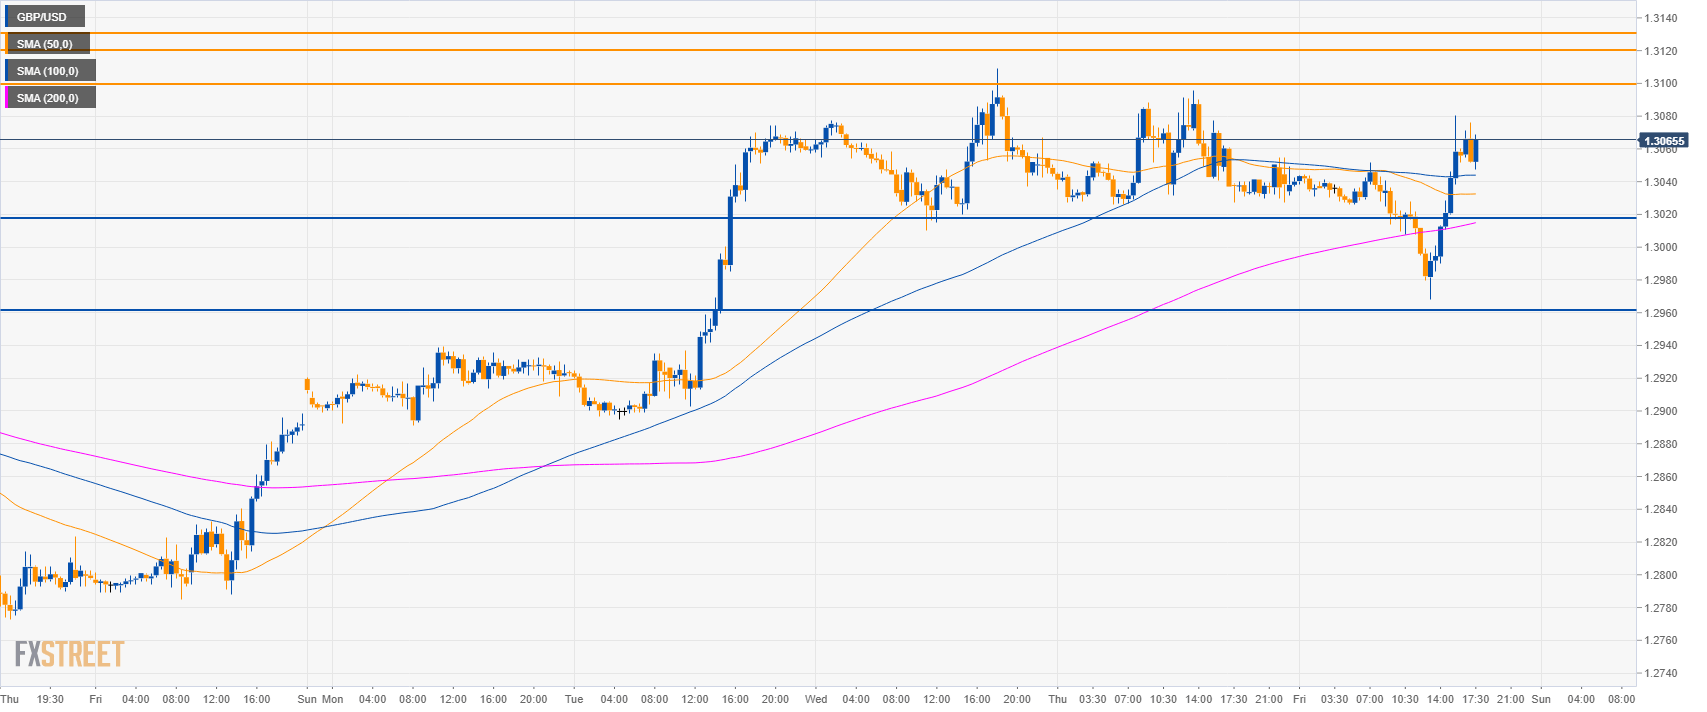
GBP/USD 30-minute chart
- GBP/USD is trading above the main SMAs suggesting bullish momentum in the short-term.
- Bulls need to break 1.3100 figure to reach 1.3120, 1.3135 and 1.3185 level to the upside.
- Support is at 1.3020 and 1.2960 level.
Additional key levels:
GBP/USD
Overview:
Today Last Price: 1.3061
Today Daily change: 23 pips
Today Daily change %: 0.18%
Today Daily Open: 1.3038
Trends:
Daily SMA20: 1.2997
Daily SMA50: 1.2858
Daily SMA100: 1.2879
Daily SMA200: 1.2997
Levels:
Previous Daily High: 1.3096
Previous Daily Low: 1.3026
Previous Weekly High: 1.2959
Previous Weekly Low: 1.2773
Previous Monthly High: 1.3214
Previous Monthly Low: 1.2438
Daily Fibonacci 38.2%: 1.3053
Daily Fibonacci 61.8%: 1.3069
Daily Pivot Point S1: 1.301
Daily Pivot Point S2: 1.2983
Daily Pivot Point S3: 1.2941
Daily Pivot Point R1: 1.308
Daily Pivot Point R2: 1.3123
Daily Pivot Point R3: 1.315
