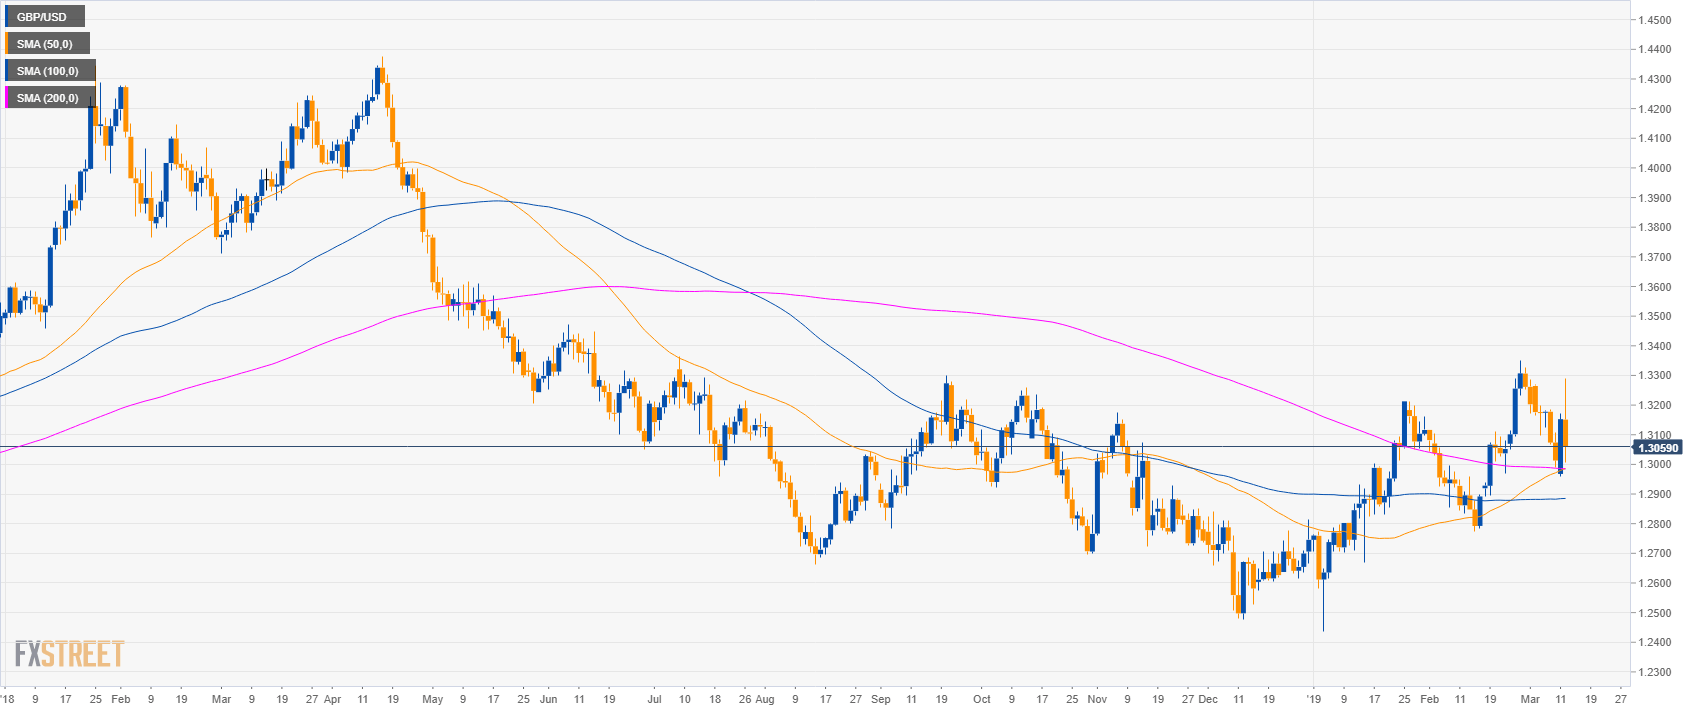
GBP/USD daily chart
- GBP/USD is trading in a bull trend above its main simple moving averages.
- GBP/USD is undecided where to go next as investors are awaiting the Brexit Vote.
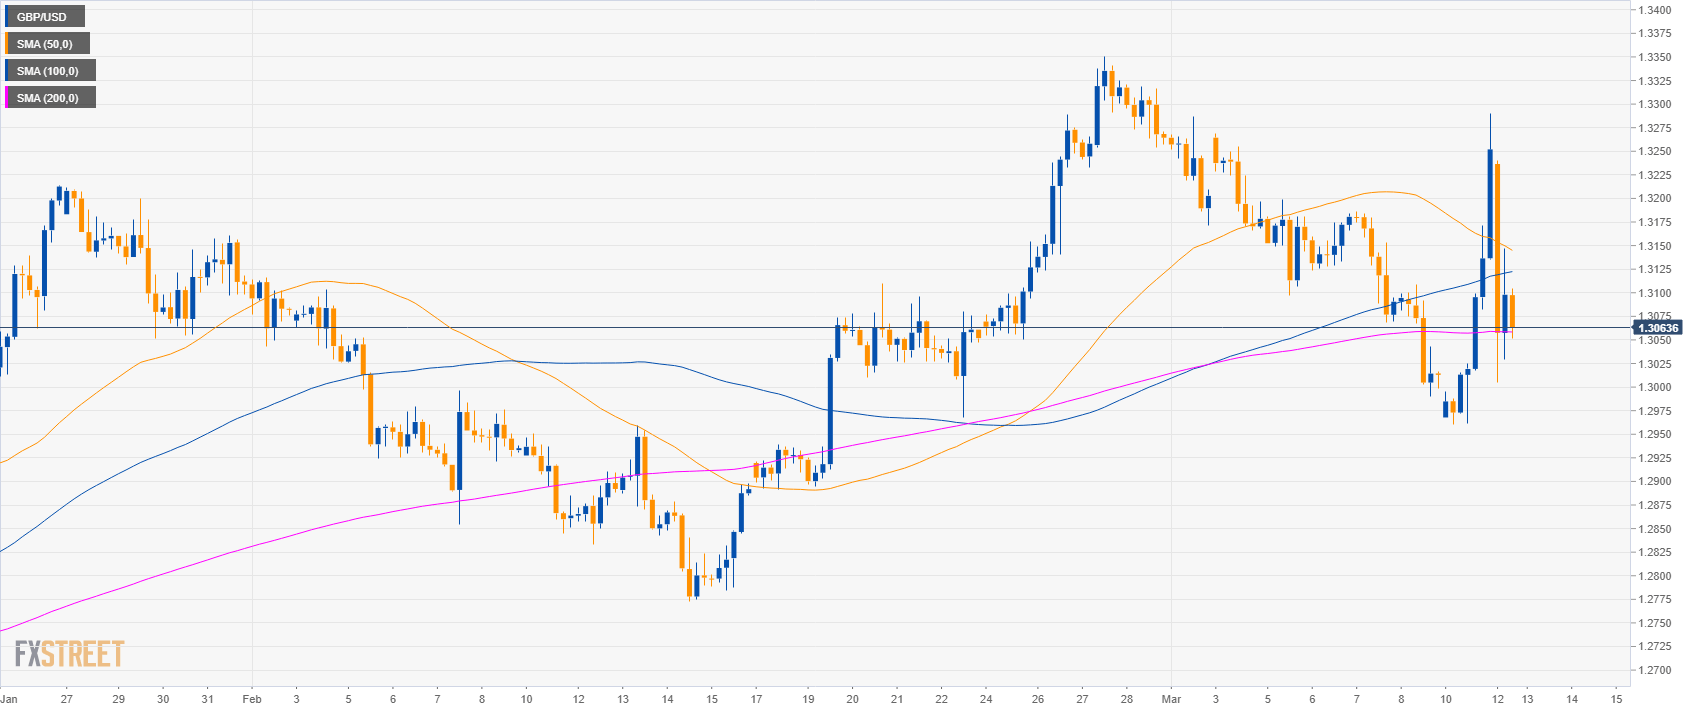
GBP/USD 4-hour chart
- GBP/USD is trading between the 100 and 200 SMAs suggesting a consolidation phase in the medium-term.
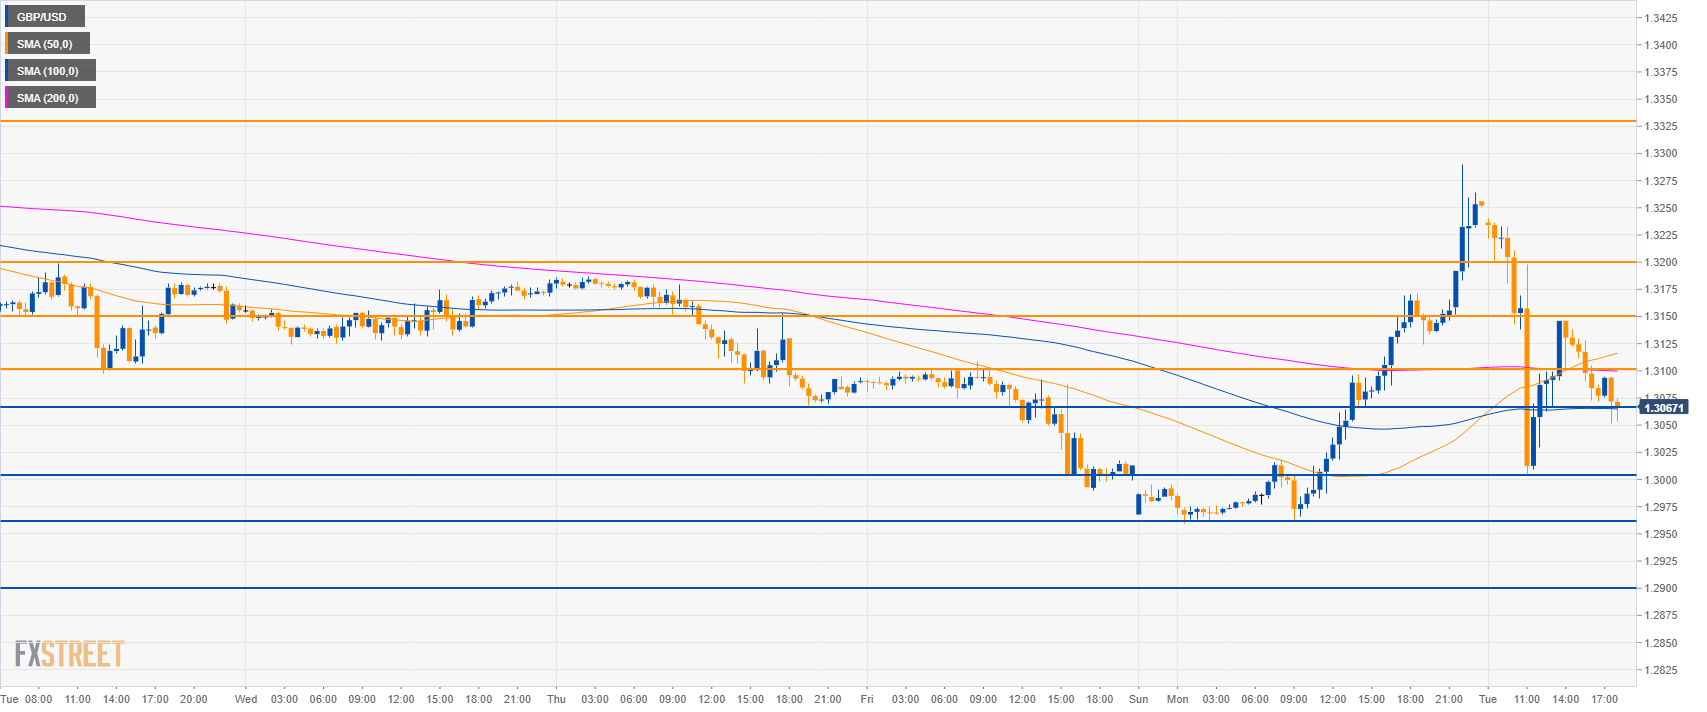
GBP/USD 30-minute chart
- GBP/USD is trading between the 100 and 200 SMAs suggesting a range market in the short-term.
- A break above 1.3100 can lead to 1.3150 and 1.3200 resistances.
- To the downside, supports are seen near 1.300 figure, 1.2960 and 1.2900 figure.
Additional key levels
GBP/USD
Overview:
Today Last Price: 1.3072
Today Daily change: -80 pips
Today Daily change %: -0.61%
Today Daily Open: 1.3152
Trends:
Daily SMA20: 1.3073
Daily SMA50: 1.298
Daily SMA100: 1.2884
Daily SMA200: 1.2986
Levels:
Previous Daily High: 1.3171
Previous Daily Low: 1.296
Previous Weekly High: 1.3269
Previous Weekly Low: 1.299
Previous Monthly High: 1.3351
Previous Monthly Low: 1.2773
Daily Fibonacci 38.2%: 1.309
Daily Fibonacci 61.8%: 1.3041
Daily Pivot Point S1: 1.3018
Daily Pivot Point S2: 1.2884
Daily Pivot Point S3: 1.2807
Daily Pivot Point R1: 1.3229
Daily Pivot Point R2: 1.3305
Daily Pivot Point R3: 1.344
