- GBP/USD is trying to fall below the low established in May at 1.2560.
- A daily close below 1.2560 (May low) would open the doors to 1.2500 handle.
- GBP/USD hit a low of 1.1253 which was not seen since January 2019.
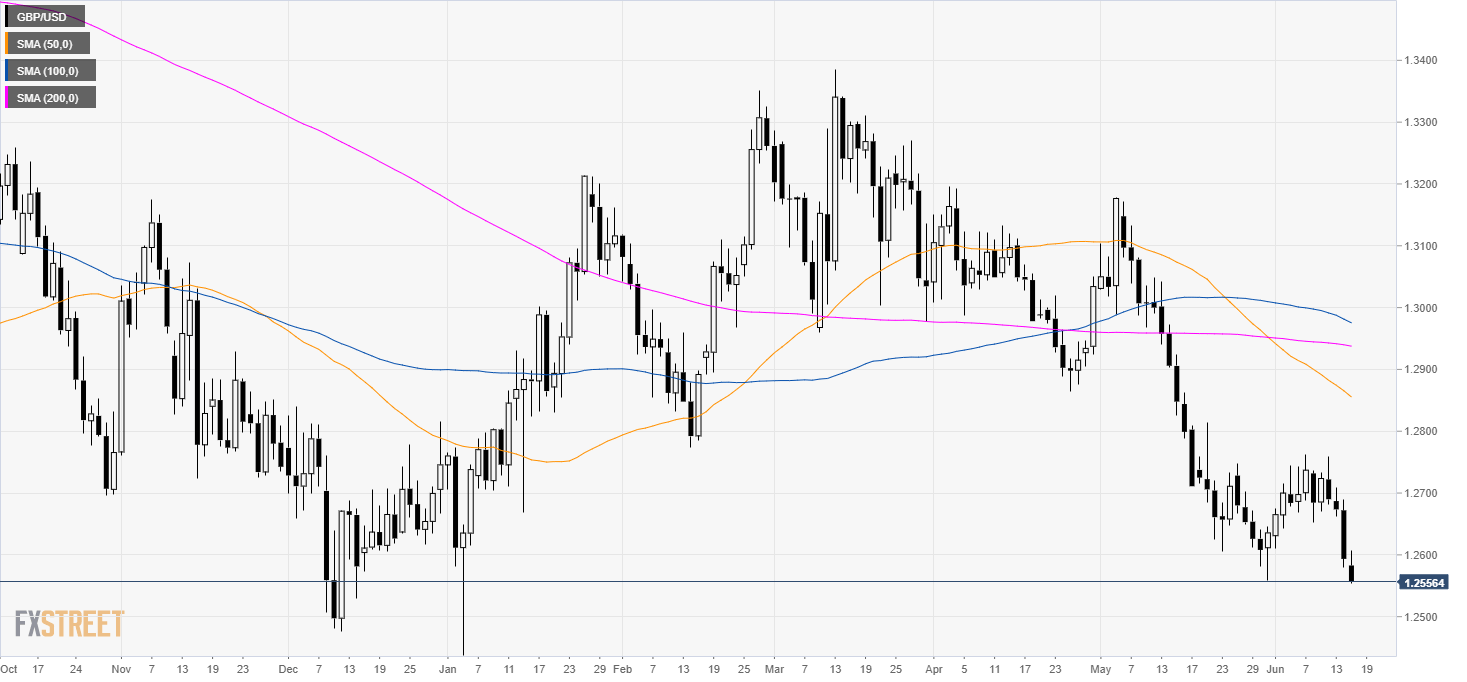
GBP/USD daily chart
GBP/USD in a bear trend below its main simple moving averages. The market is attempting to break below the lowest point in May at 1.2560. Investors will be on the lookout to see if the market can close Monday below this level.

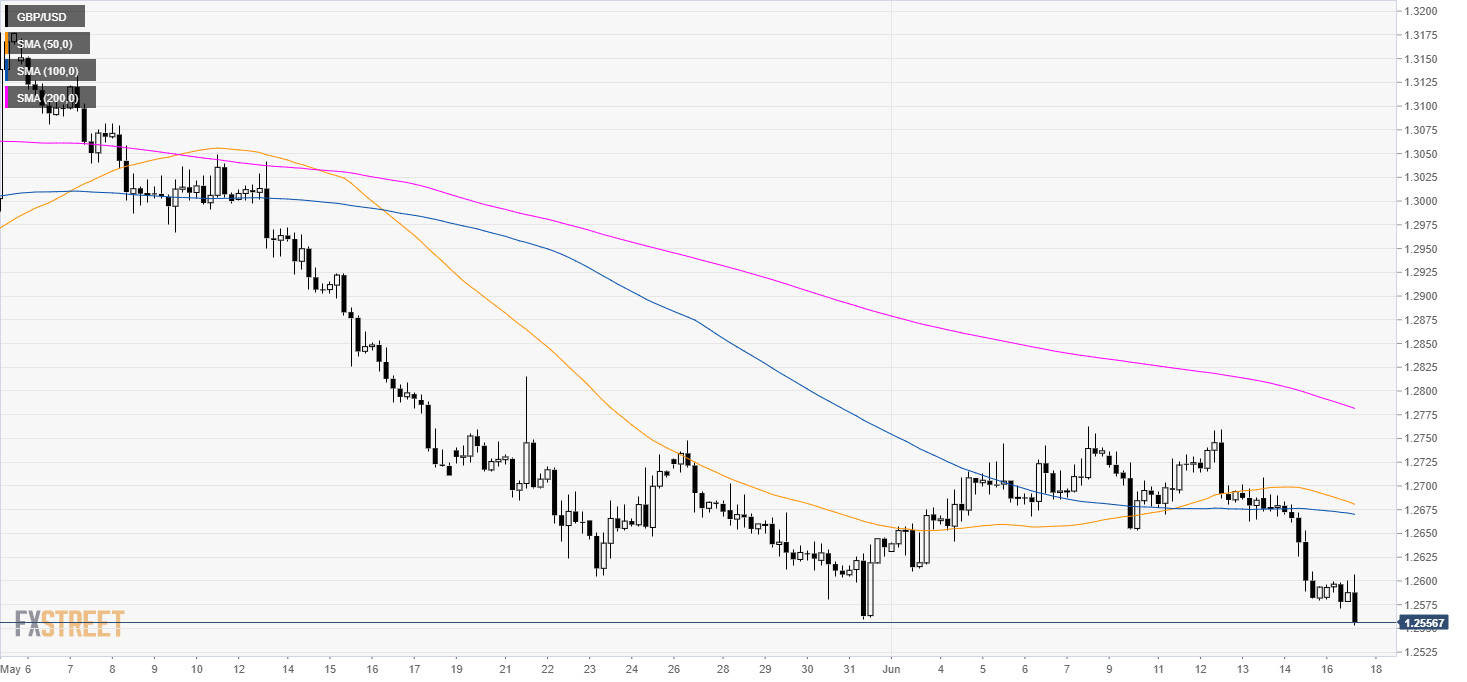
GBP/USD 4-hour chart
The market remains under bearish pressure near 1.260 and the main simple moving averages (SMAs). Bullish activity has been pretty scarce as bears are bears are in control.
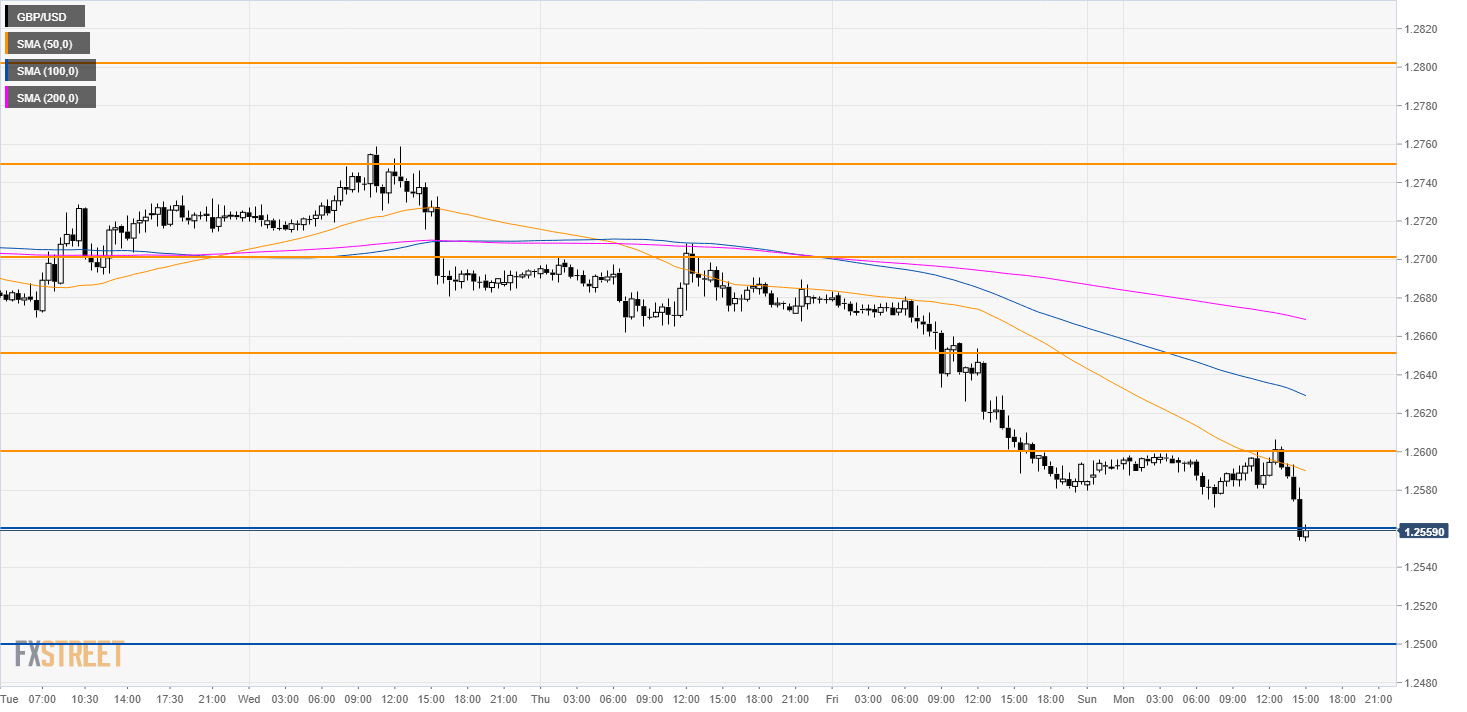
GBP/USD 30-minute chart
Starling tested the 1.2600 handle and 50 SMA and the bears stepped in. A daily close below 1.2560 would be seen as very bearish with a potential continuation towards 1.2500. Resistance is at 1.2600 and 1.2650 level.

Additional key levels