- The Sterling is confined in the range of the last two days.
- The level to beat for bears is at 1.2313 support.
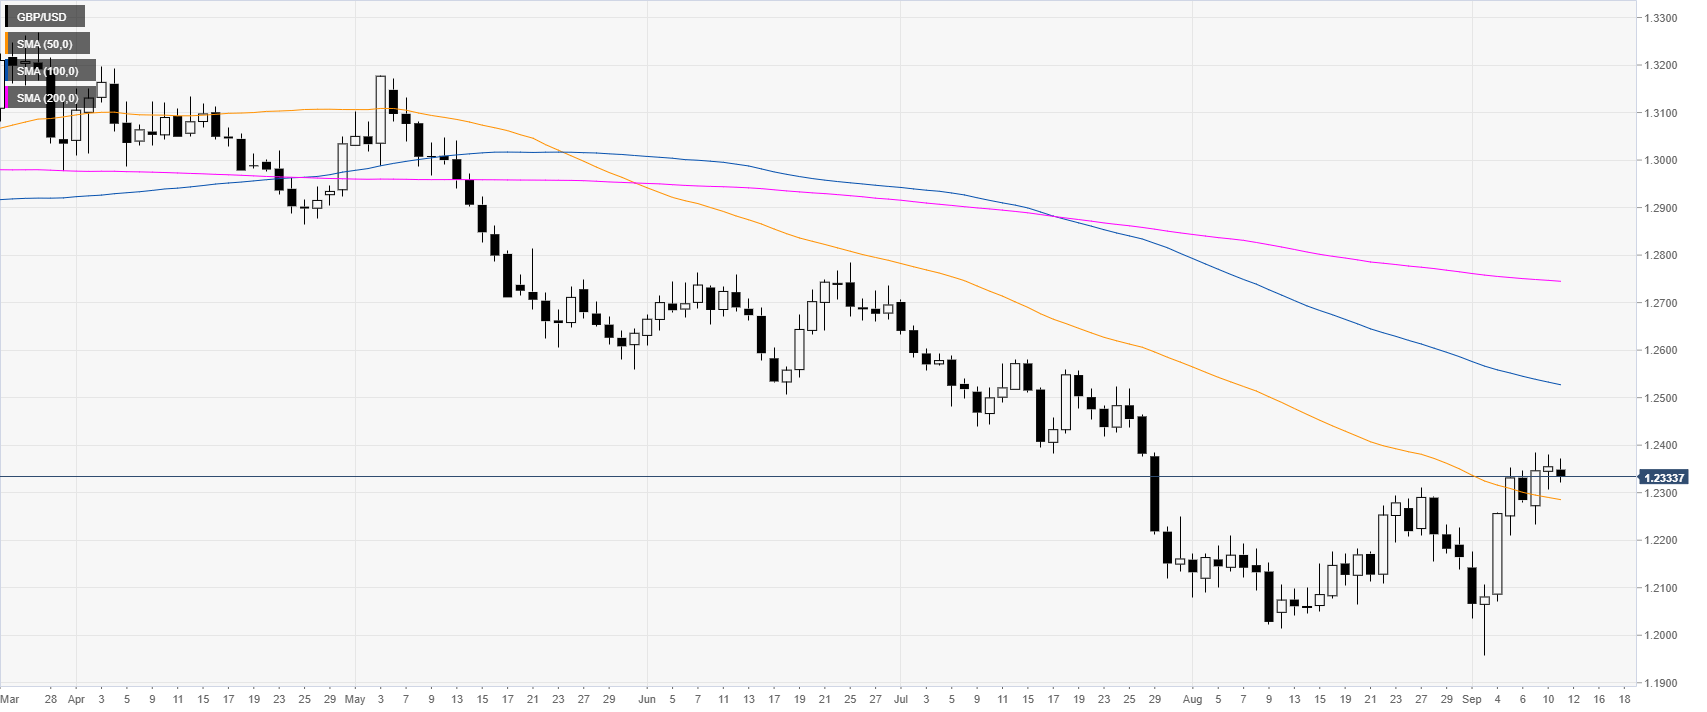
GBP/USD daily chart
The Sterling is trading in a bear trend below the 100 and 200-day simple moving averages (SMAs). GBP/USD is stalling below the 1.2400 figure as the market is consolidating above the 50 SMA.
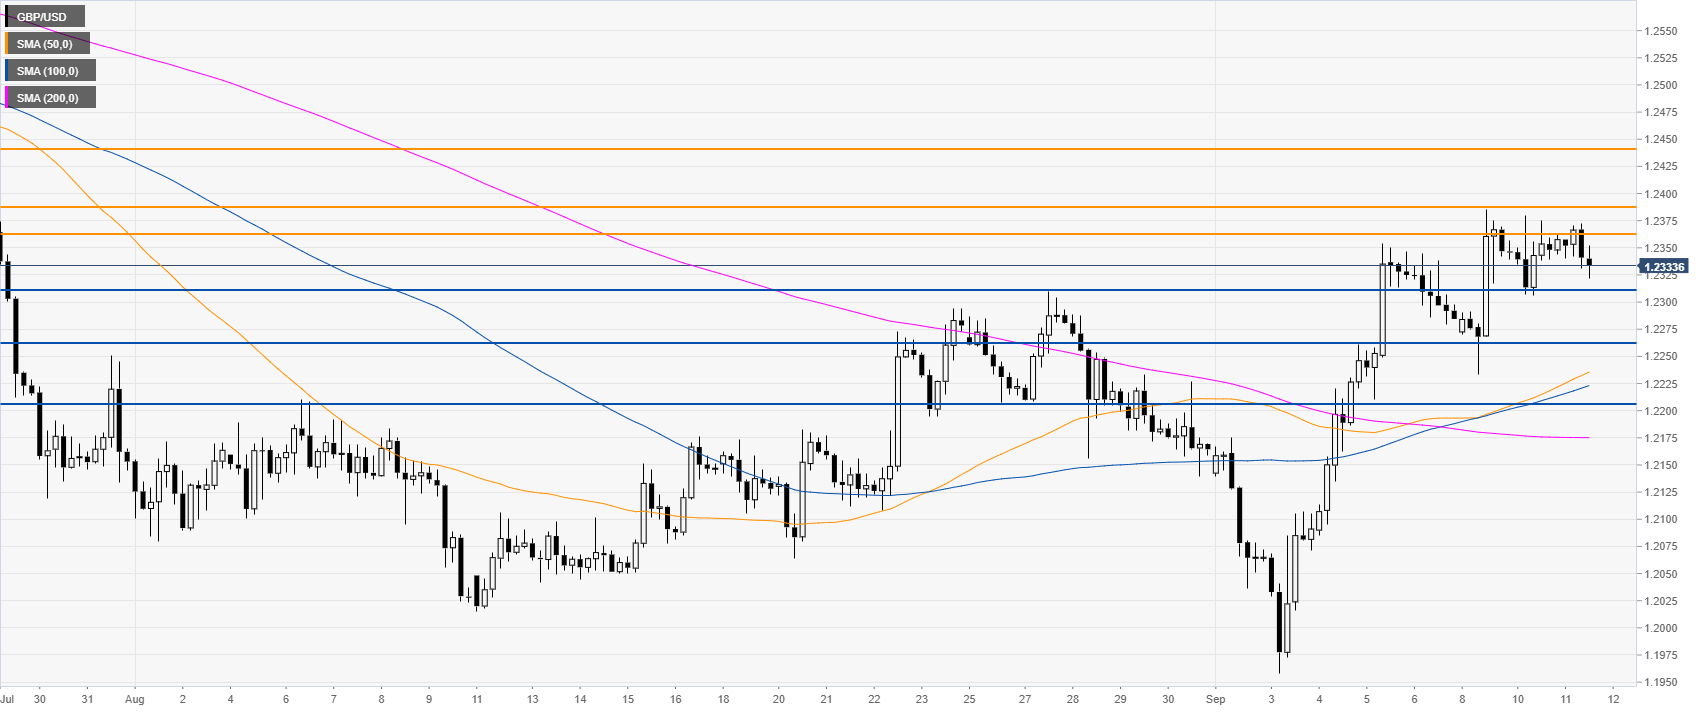
GBP/USD four-hour chart
GBP/USD is having a hard time to pierce 1.2360 resistance. A daily close above this level is necessary to attract buying interest towards 1.2390 and 1.2440 resistance levels, according to the Technical Confluences Indicator.
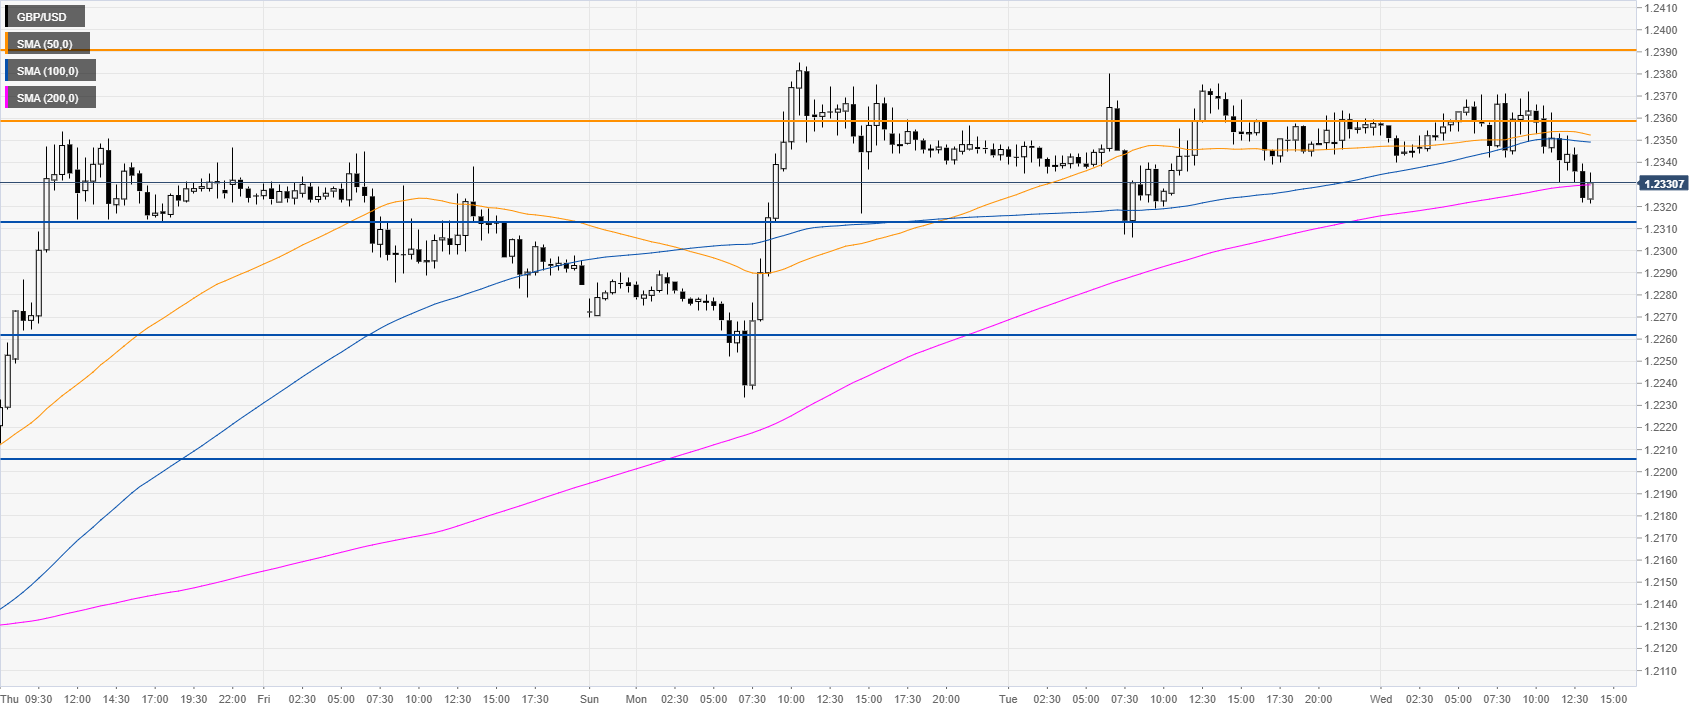
GBP/USD 30-minute chart
The Pound is trading below the main SMAs, suggesting bearish momentum in the near term. Bears might be looking for a break of the 1.2313 key support to reach 1.2262 and 1.2205 levels on the way down, according to the Technical Confluences Indicator.
Additional key levels
