- GBP/USD is trading near the weekly lows below 1.2478.
- The level to beat for sellers are at 1.2433 and 1.2388, according to the Technical Confluences Indicator.
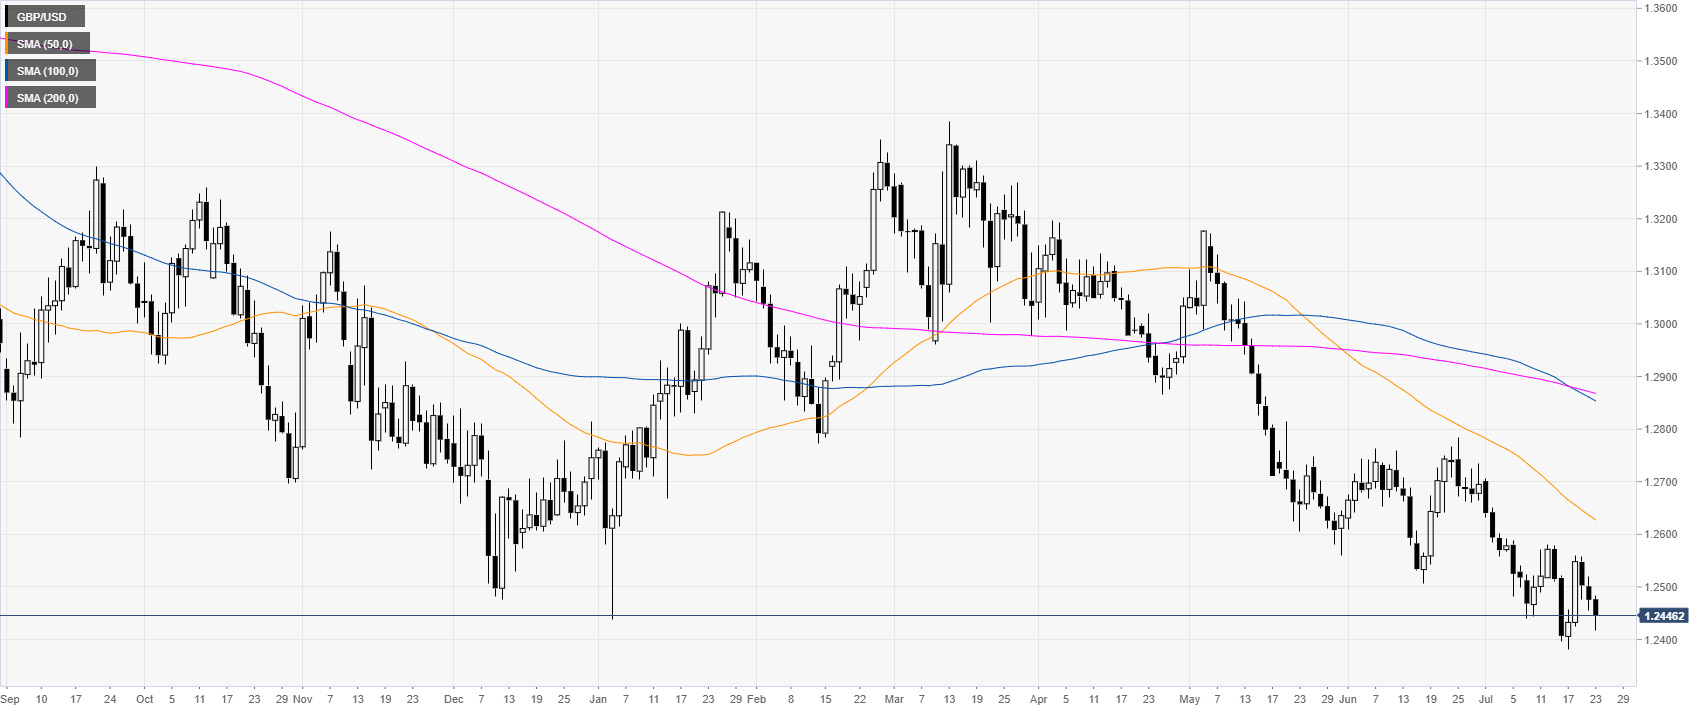
GBP/USD daily chart
Cable is in a bear trend below the main daily simple moving averages (DSMAs). The US Dollar is gaining ground across the board this Tuesday.
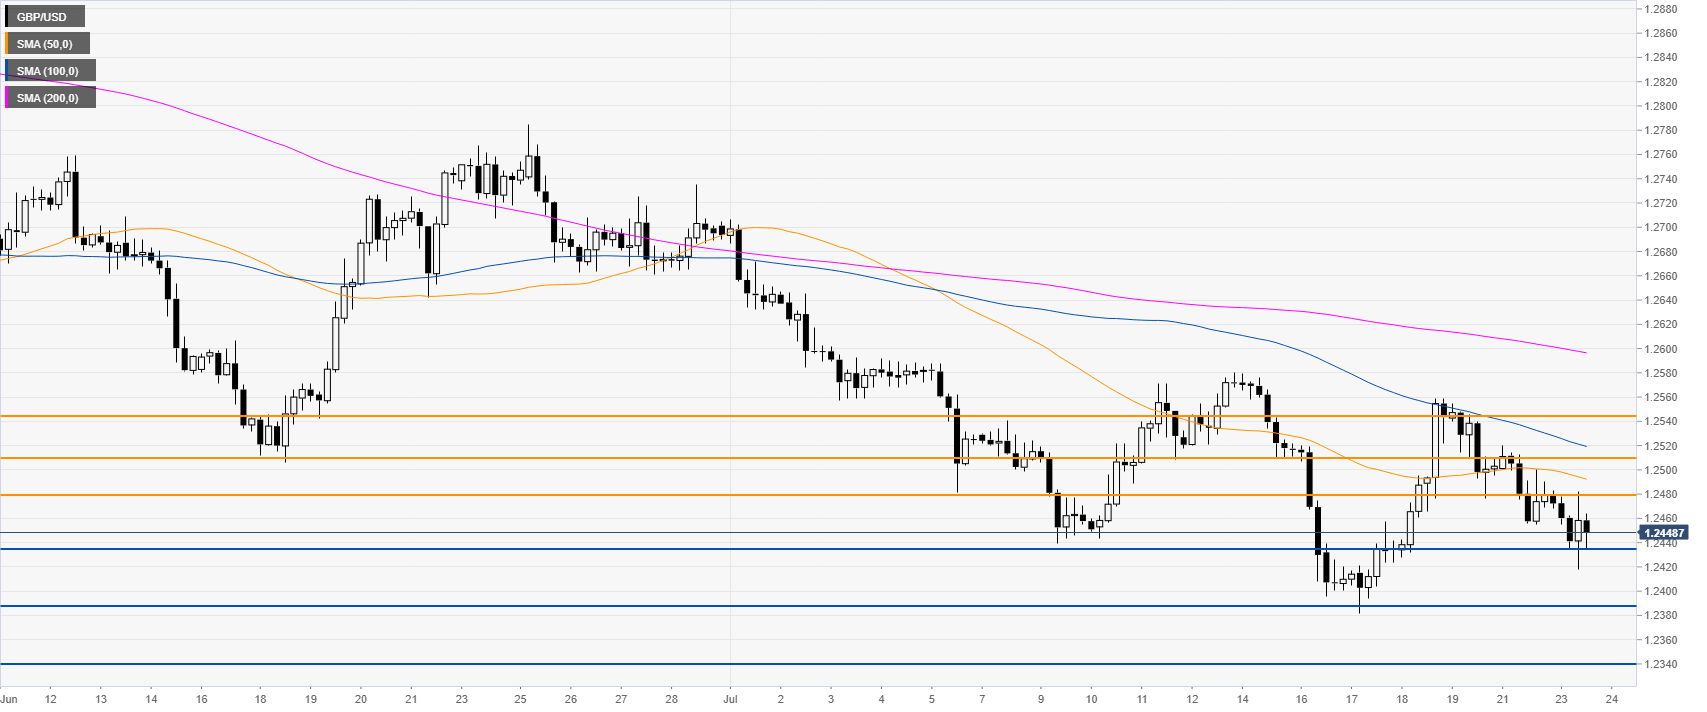
GBP/USD 4-hour chart
Cable is trading below the 1.2478 resistance level and its main SMAs. Bears want a daily close below 1.2433 to each 1.2388 on the way down, according to the Technical Confluences Indicator.
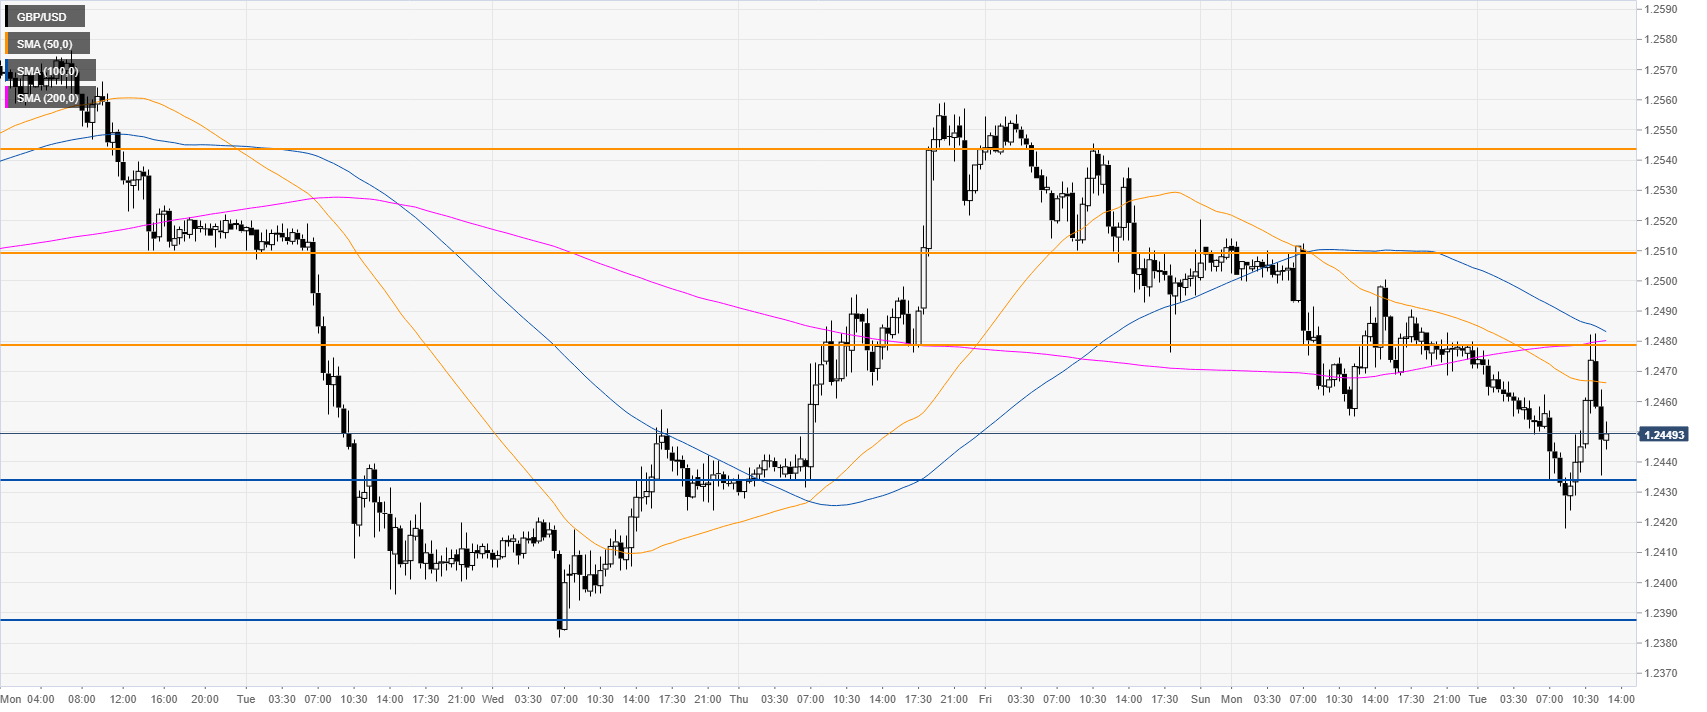
GBP/USD 30-minute chart
GBP/USDis trading below its main SMAs suggesting bearish momentum. Immediate resistances are seen at 1.2478 and 1.2543.
Additional key levels
