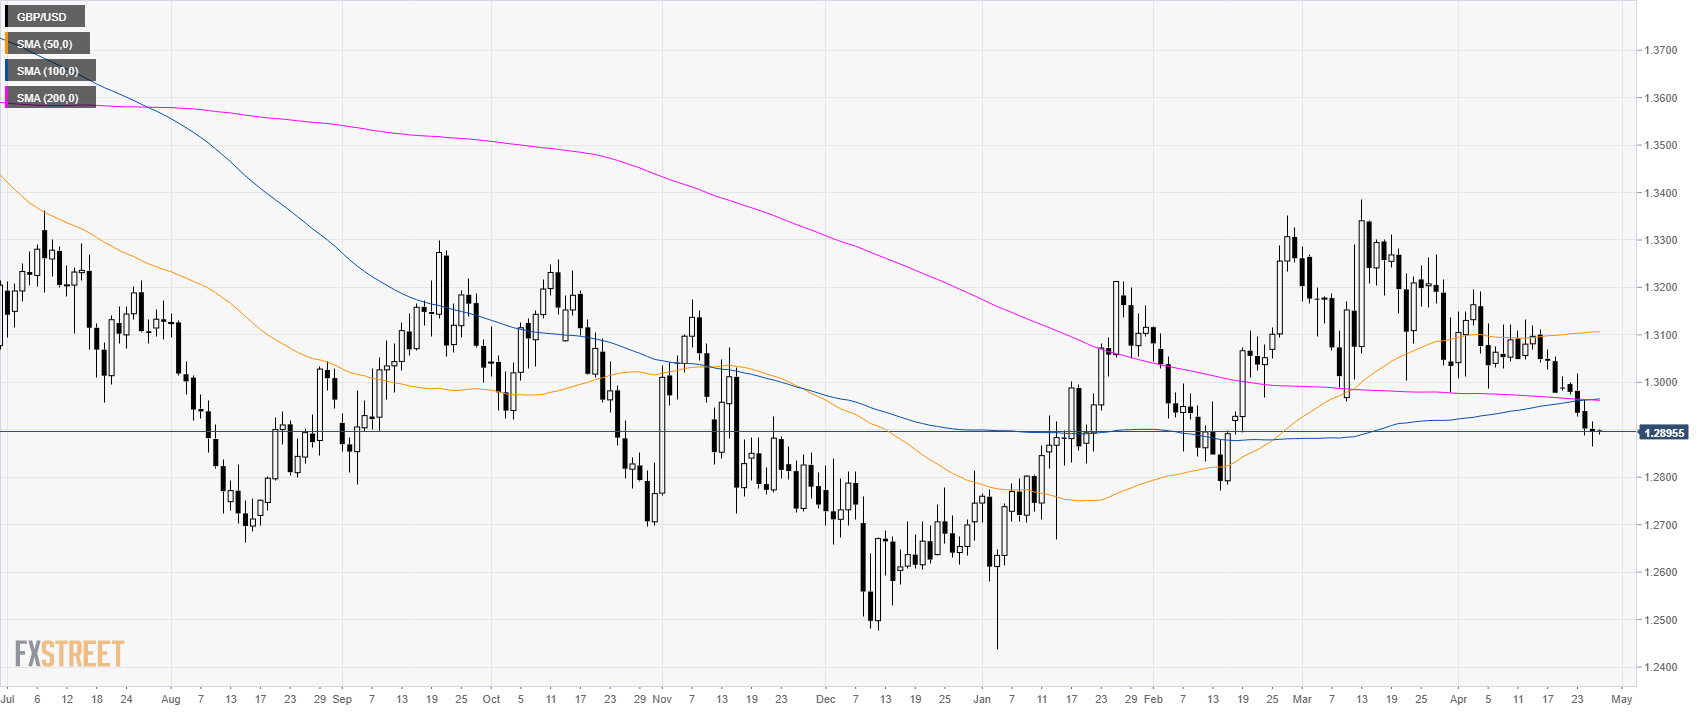
Home GBP/USD Technical Analysis: Cable weakening below 1.2920 level
FXStreet News

GBP/USD Technical Analysis: Cable weakening below 1.2920 level

GBP/USD daily chart

  • GBP/USD is drifting down below its main SMAs suggesting an overall bearish bias.


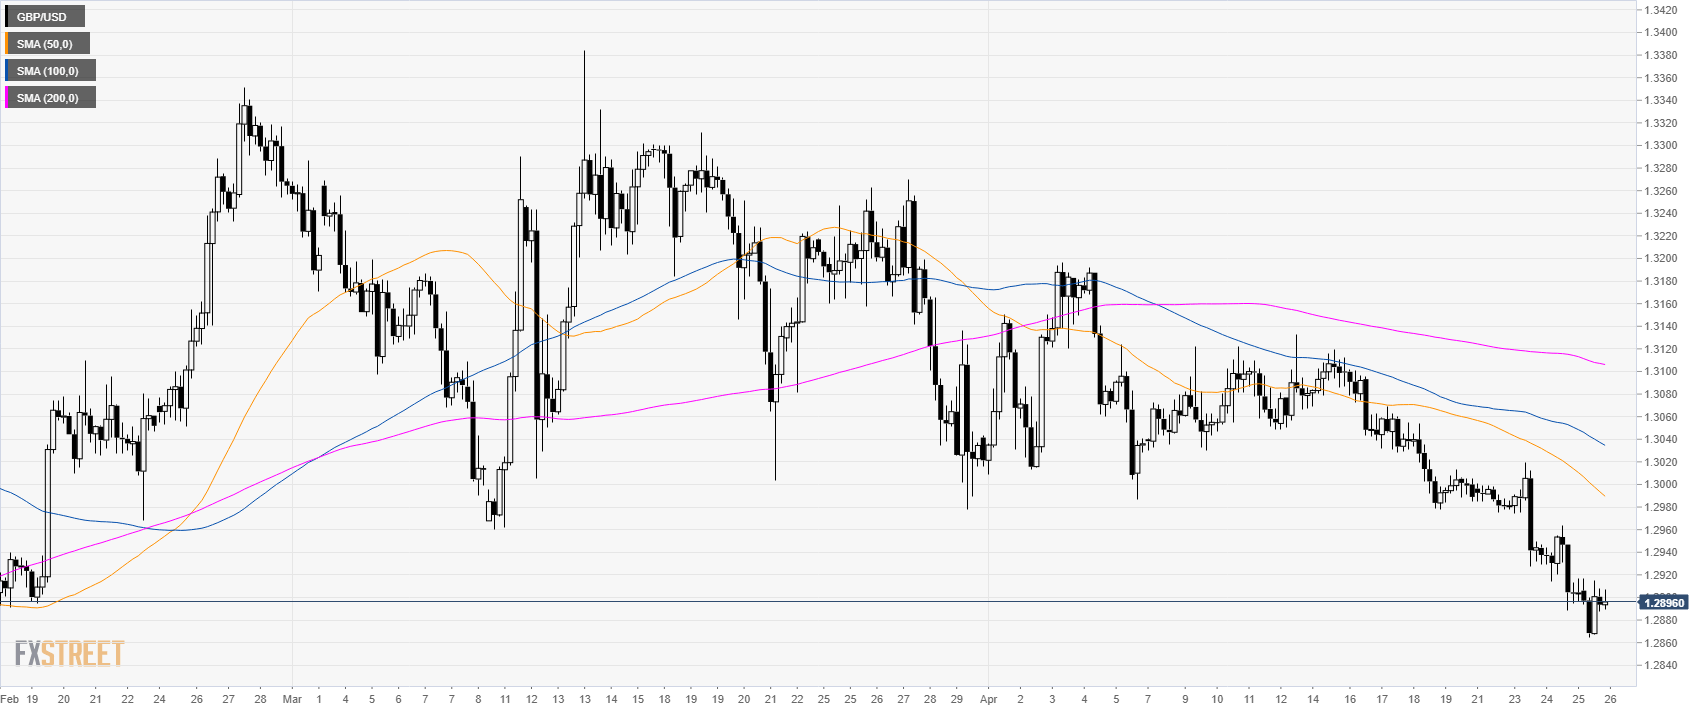
GBP/USD 4-hour chart

  • GBP/USD is evolving below its main SMAs suggesting bearish momentum in the medium-term.

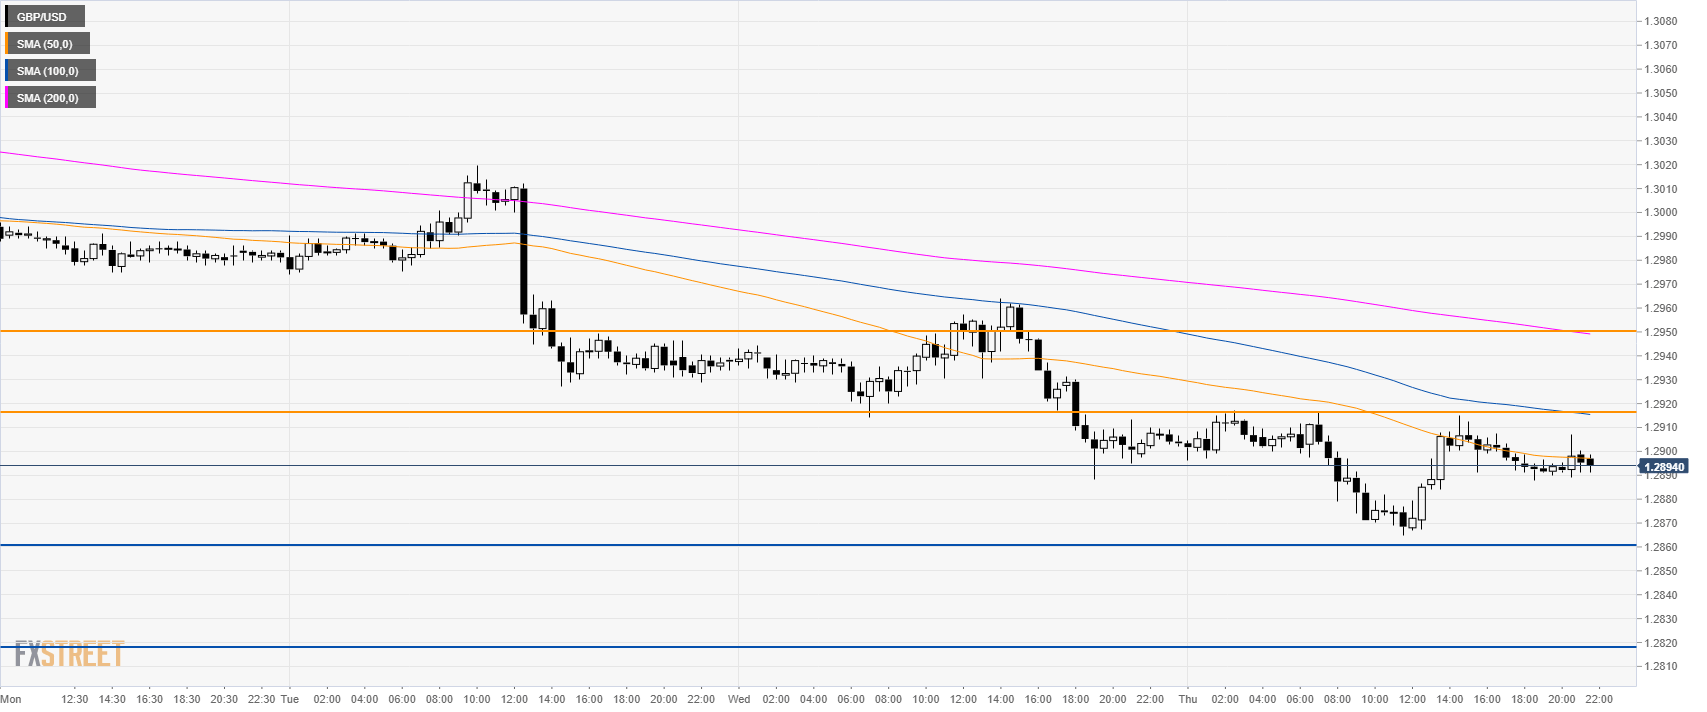
GBP/USD 30-minute chart

  • GBP/USD is capped below the 1.2920 resistance and the 50 SMA.  
  • The bias stays tilted to the downside as the level to beat for bears is 1.2860 and 1.2820 support.
  • Resistances are seen at 1.2920 and 1.2950 level.


Additional key levels


FX Street

FX Street

FXStreet is the leading independent portal dedicated to the Foreign Exchange (Forex) market. It was launched in 2000 and the portal has always been proud of their unyielding commitment to provide objective and unbiased information, to enable their users to take better and more confident decisions.