- The American Core Consumer Price Index (YoY) came slightly below expecations at 2.1% vs. 2% forecast.
- The news had a limited reaction on Cable.
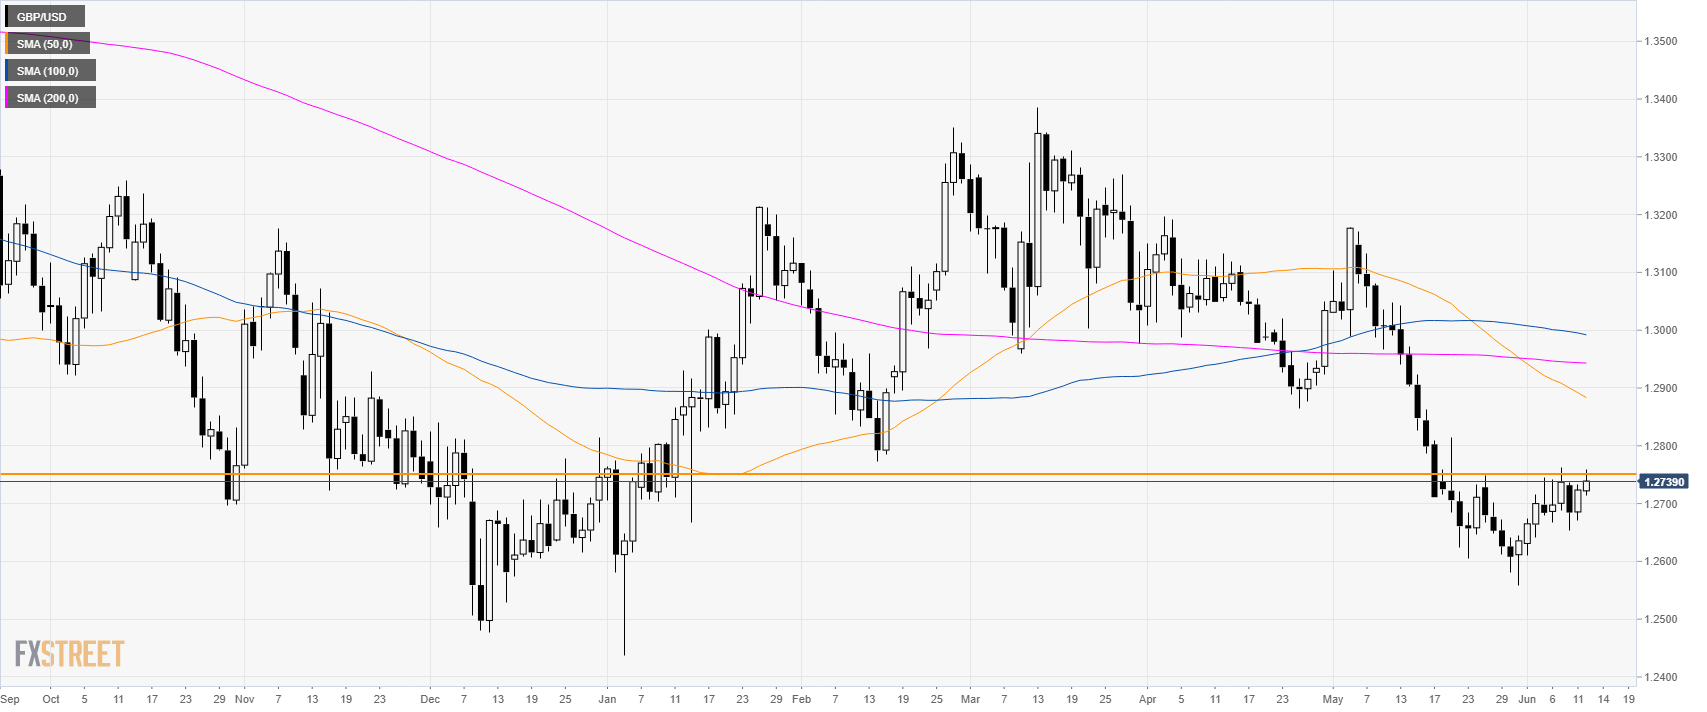
GBP/USD daily chart
GBP/USD is in consolidation mode after the intense selling seen in May. The recovery is for now capped at 1.2750 resistance.
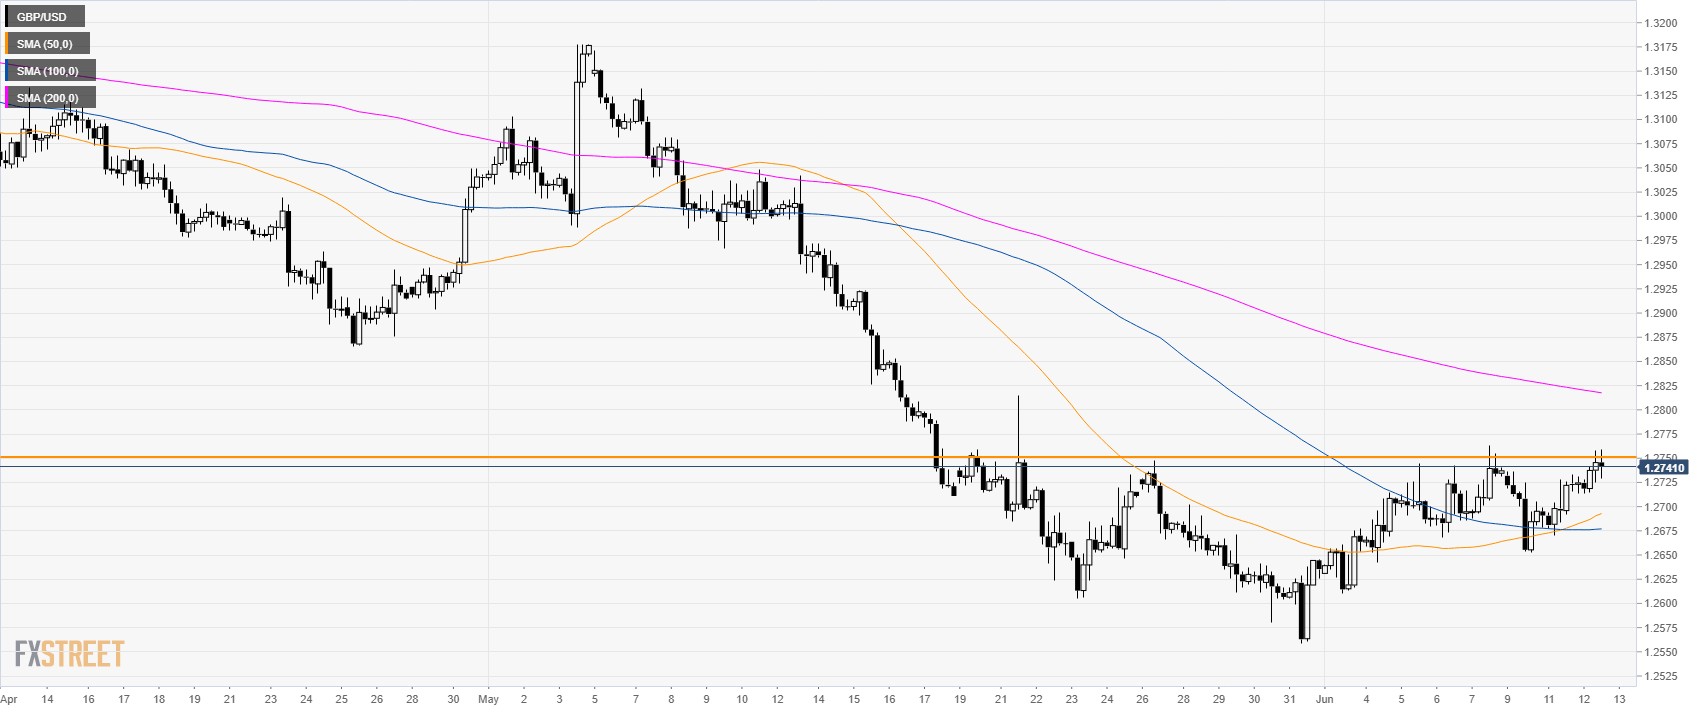
GBP/USD 4-hour chart
Cable is challenging 1.2750 while above its 50 and 100 SMA suggesting a consolidation for the time being.
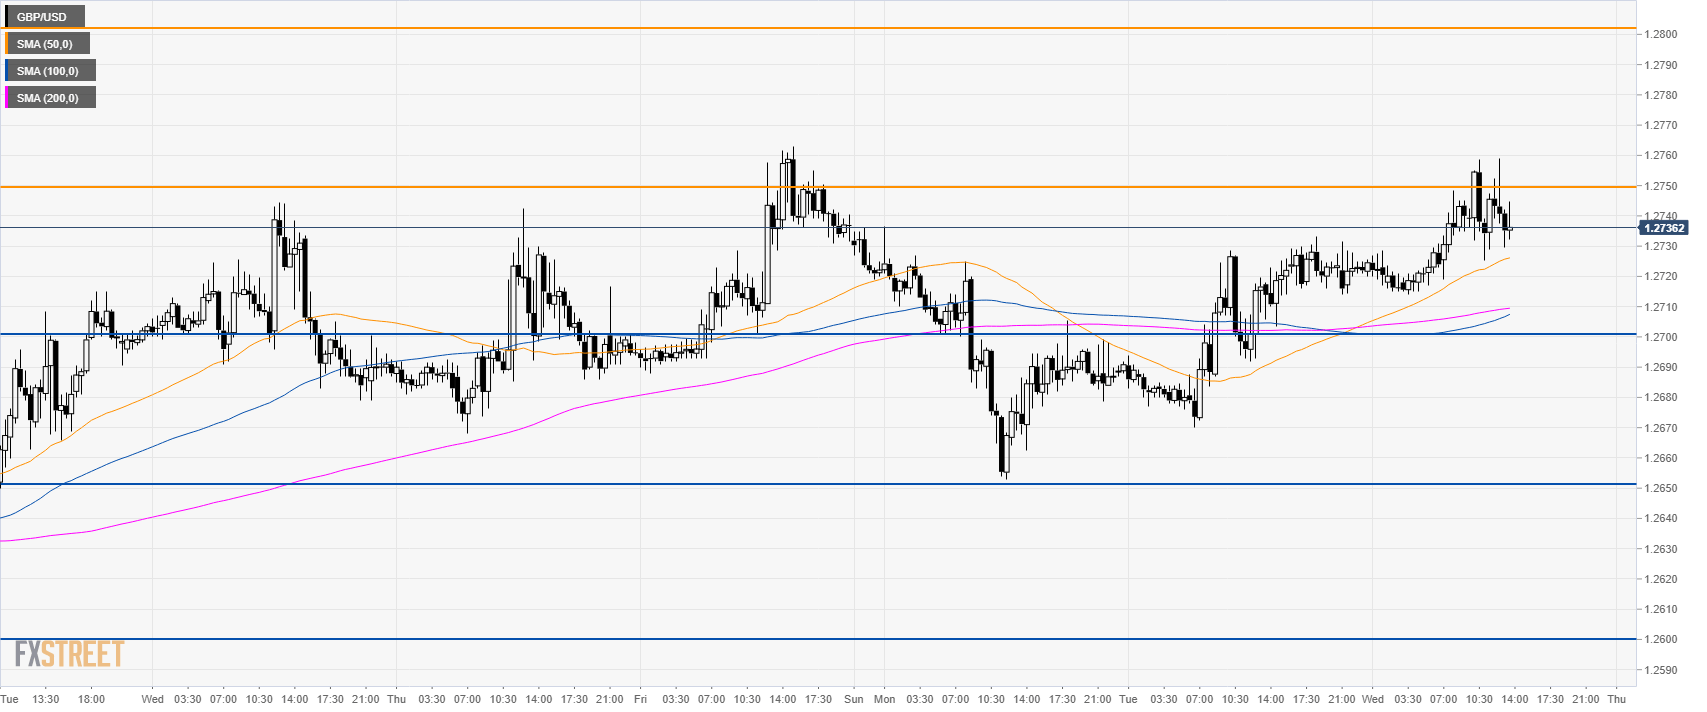
GBP/USD 30-minute chart
The range theme stays intact as GBP/USD is trading between the 1.2650 and 1.2750 levels. Buyers need a break beyond 1.2750 to get to 1.2800 while bears need a breakdown below 1.2700 to reach 1.2650 and 1.2600 figure.
Additional key levels
