- Less moves expected unless the 1.2660 – 1.2750 holds the quote.
- RSI also shows a lack of momentum.
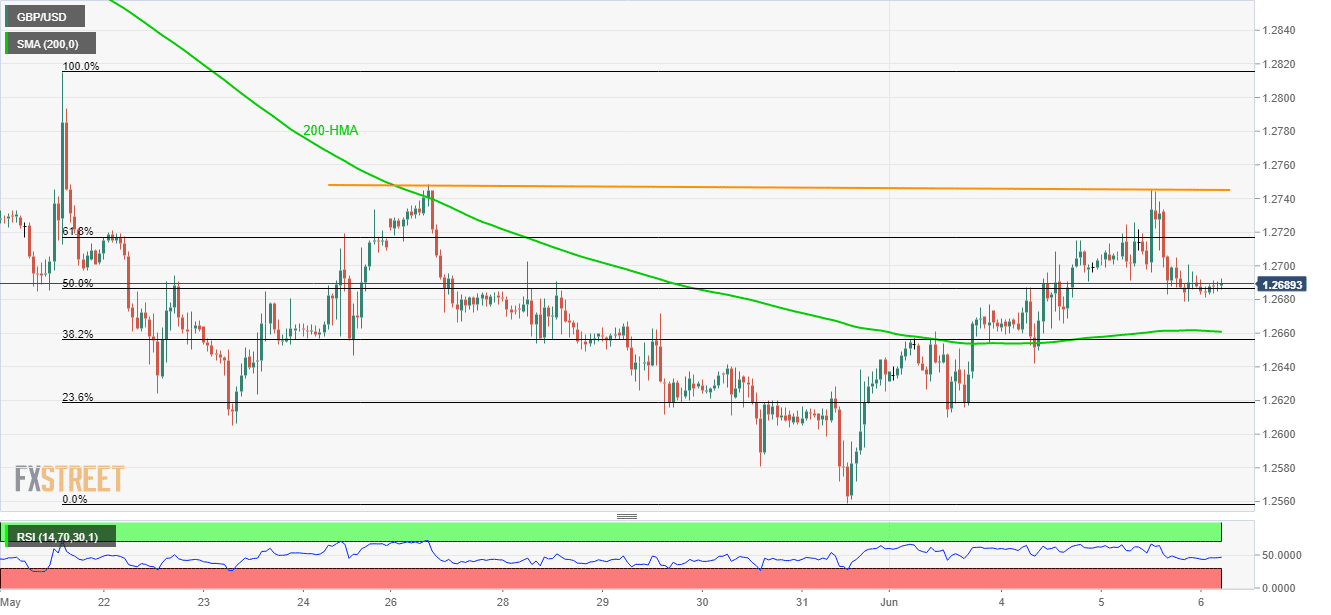
The GBP/USD pair clings to 50% Fibonacci retracement of its late-May month moves as it trades near 1.2690 ahead of the UK markets’ open on Thursday.
The pair has a 10-day horizontal-line stretched since May 27 that caps its upside around 1.2750 whereas 200-hour moving average (HMA) near 1.2660 limits near-term declines.
Additionally, 14-bar relative strength index (RSI) also behaves normally, signaling less action between the mentioned levels.
Should prices clear 1.2660 support, 1.2610 and the latest low near 1.2580 can please sellers.
On the contrary, 1.2760 can validate the price rally above 1.2760 in the direction to 1.2815.
GBP/USD hourly chart
Trend: Sideways
