- GBP/USD takes the bids near a multi-month high flashed on Monday.
- Overbought RSI, Doji on the daily chart question bulls.
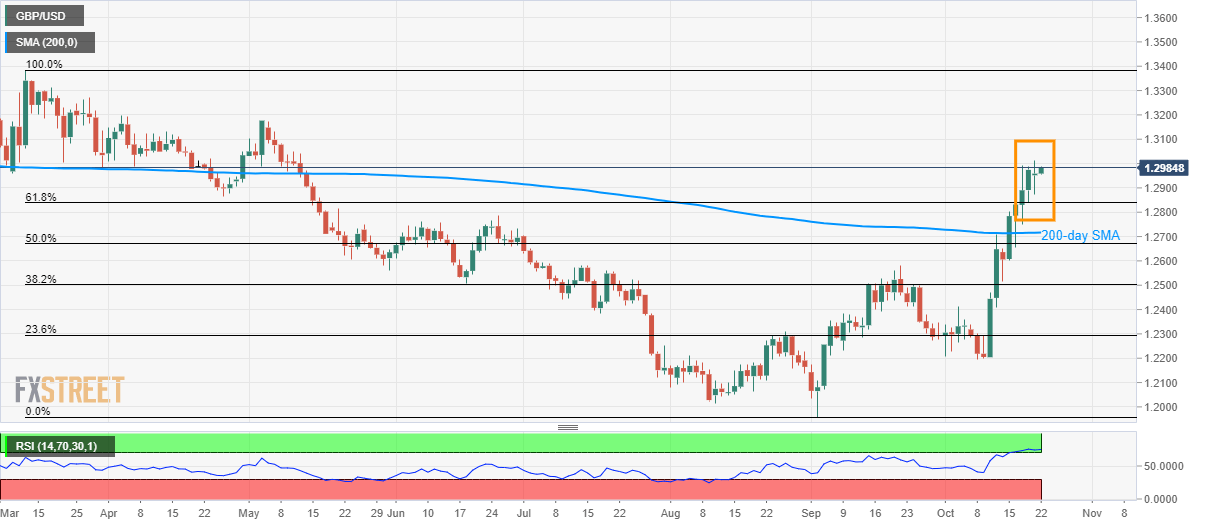
- 61.8% Fibonacci retracement and 200-day SMA gain sellers’ attention.
GBP/USD buyers have reasons to worry as the pair trades near 1.2985 prior to the London open on Tuesday.
Among them, a Doji candle on the daily chart, a bearish technical formation, and overbought conditions of 14-bar Relative Strength Index (RSI) take the first seats.
With this, bears will look for confirmations during the pair’s declines below 61.8% Fibonacci retracement of March-September downpour, at 1.2839, which in turn could drag them towards 200-day Simple Moving Average (SMA) level of 1.2716.
It should also be noted that a 50% Fibonacci retracement level of 1.2670 and September month high close to 1.2582 will please bears afterward.
Alternatively, pair’s extended rise above 1.3013 could push bulls to aim for May month ghi around 1.3180.
GBP/USD daily chart
Trend: pullback expected
