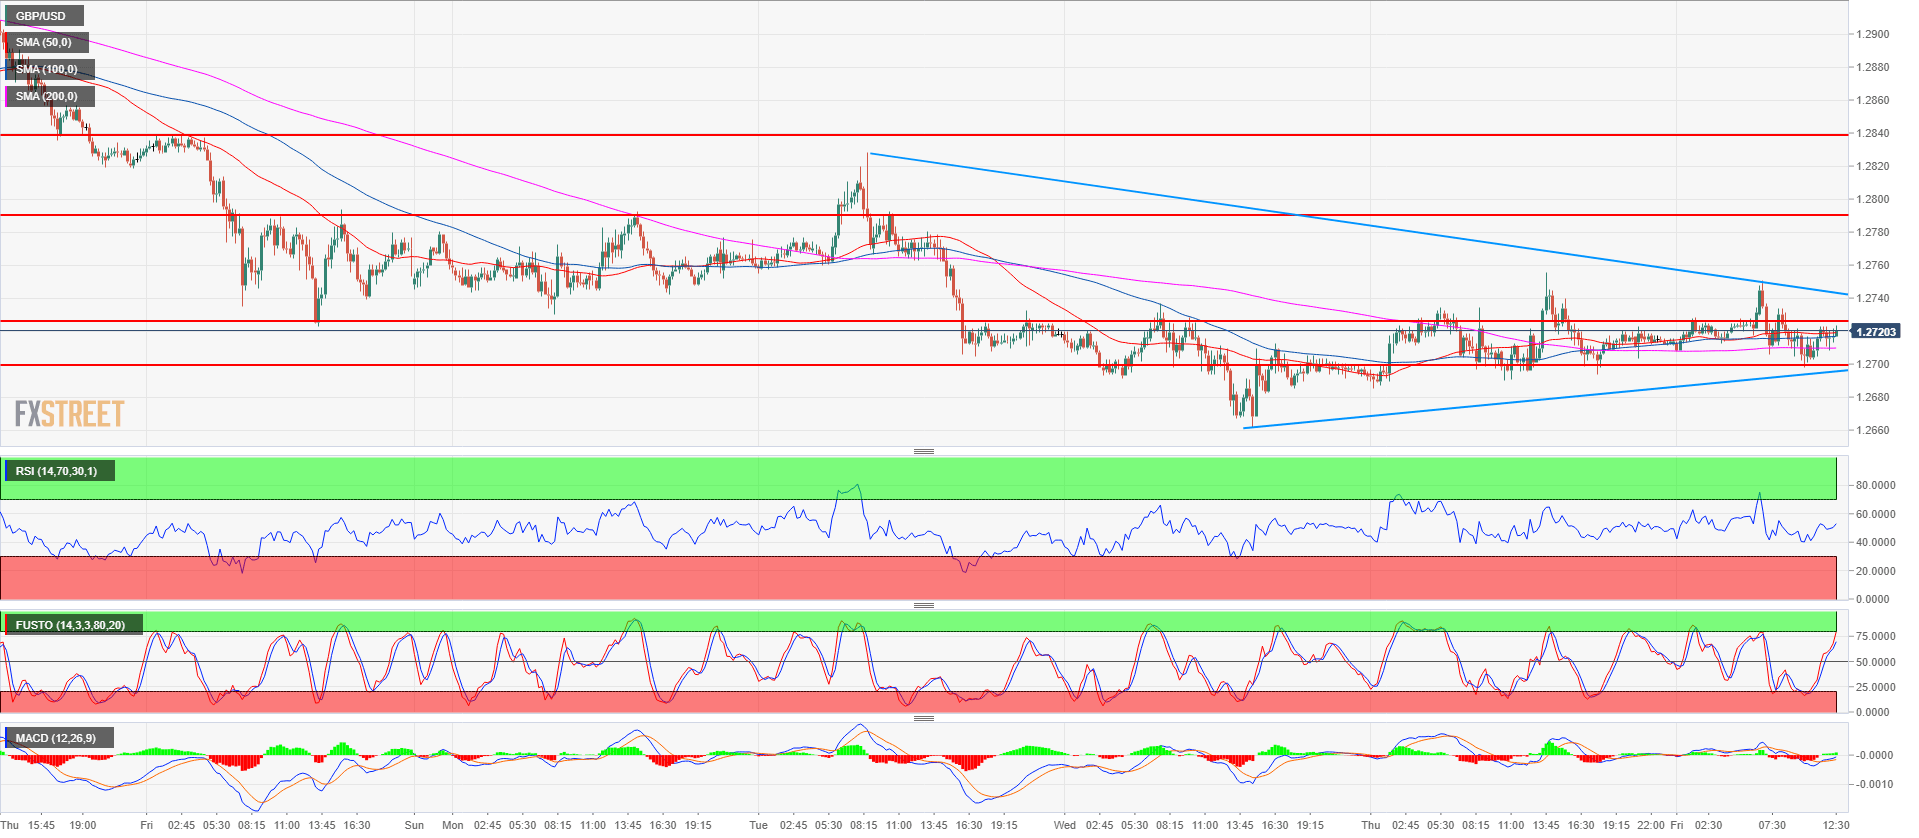
- GBP/USD bear trend is taking a breather as Cable is consolidating for the 6th day in a row.
- The extreme oversold condition on the daily RSI and the parabolic sell climax is pushing bears to take profits and bulls to initiate new long positions. While the main trend is clearly bearish, there is no clear sell signal as bulls are buying any dips. The short-term bias is bullish with targets at 1.2789 and 1.2838. GBP/USD is trying to break above the trendline on the daily chart and is consolidating within a triangle on the 15-minute chart.
- Counter-trend trades are inherently riskier, a sustained breakout below 1.2661 (current 2018 low) would invalidate the bullish bias and give the signal that the bear trend has resumed.
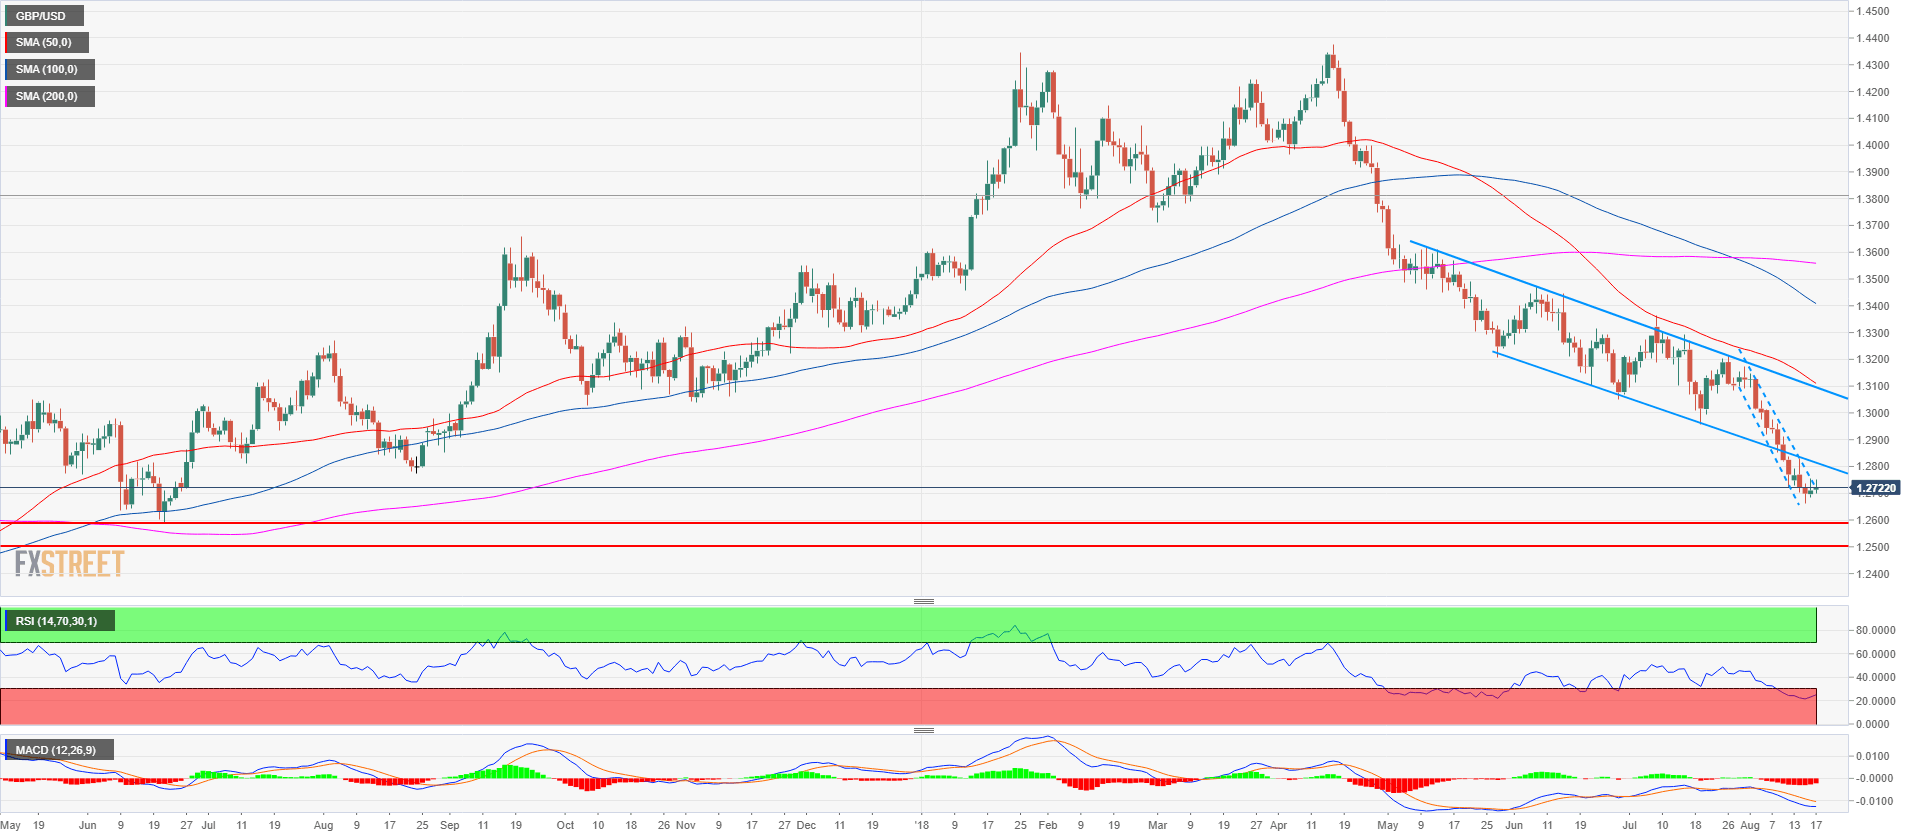
GBP/USD daily chart
Spot rate: 1.2721
Relative change: 0.09%
High: 1.2750
Low: 1.2697
Trend: Bearish
Short-term trend: Neutral to bullish
Resistance 1: 1.2723, August 10 low
Resistance 2: 1.2789 intraday swing high
Resistance 3: 1.2838, August 10 high
Resistance 4: 1.2900-1.2923 area, figure and August 7 low
Support 1: 1.2700 figure
Support 2: 1.2661, current 2018 low
Support 3: 1.2589 June 21, 2017 low
Support 4: 1.2500 figure
Support 5: 1.2365 April 7, 2017 high
