- The GBP/USD pair is seeing a quick drop into the 1.2775 region as the European continent begins to come online, and early trades are suggesting that the US Dollar could be popular today.
- Brexit excitement aside, the Cable is primed for an intraday drop after posting a lower swing high on the intraday, clipping into 1.2820 before declining in fresh Greenback bidding.
GBP/USD Chart, 5-Minute
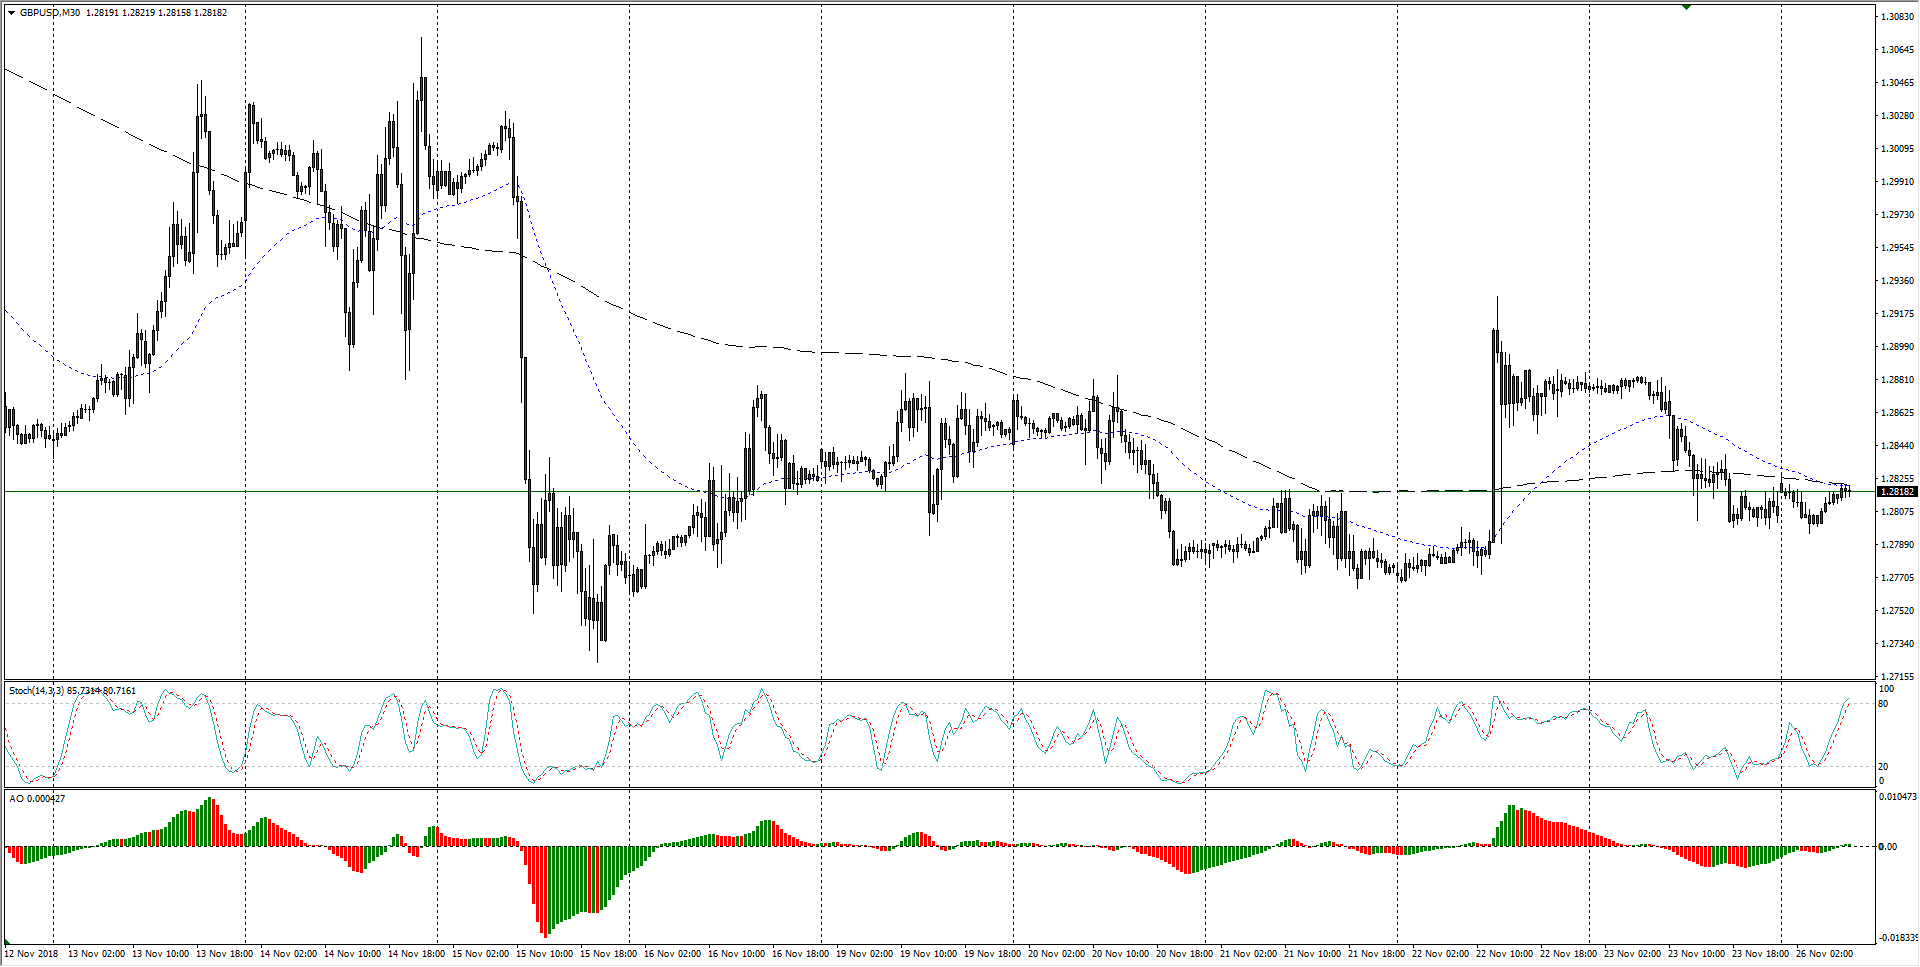
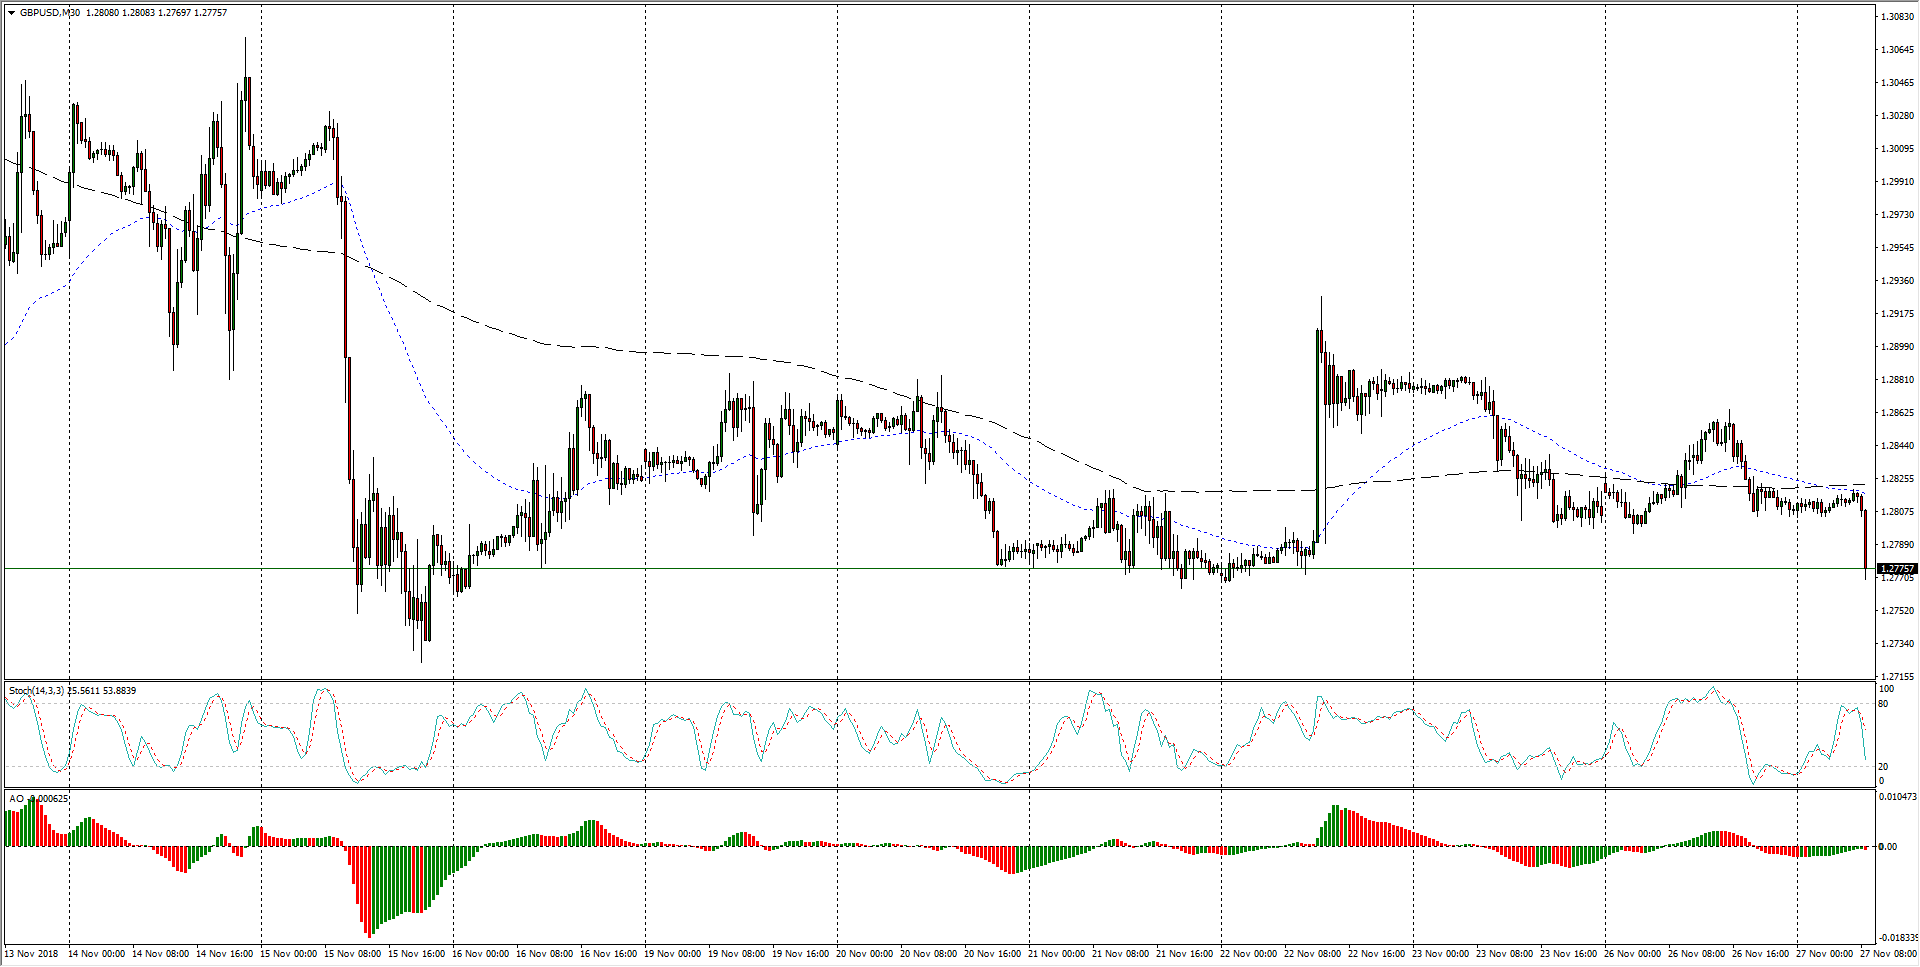
- Brexit tensions have kept the Cable in a volatile, trendless range since mid-November, but new Dollar bidding could send the GBP/USD into new lows at the 1.2700 region if selling power continues.
GBP/USD Chart, 30-Minute
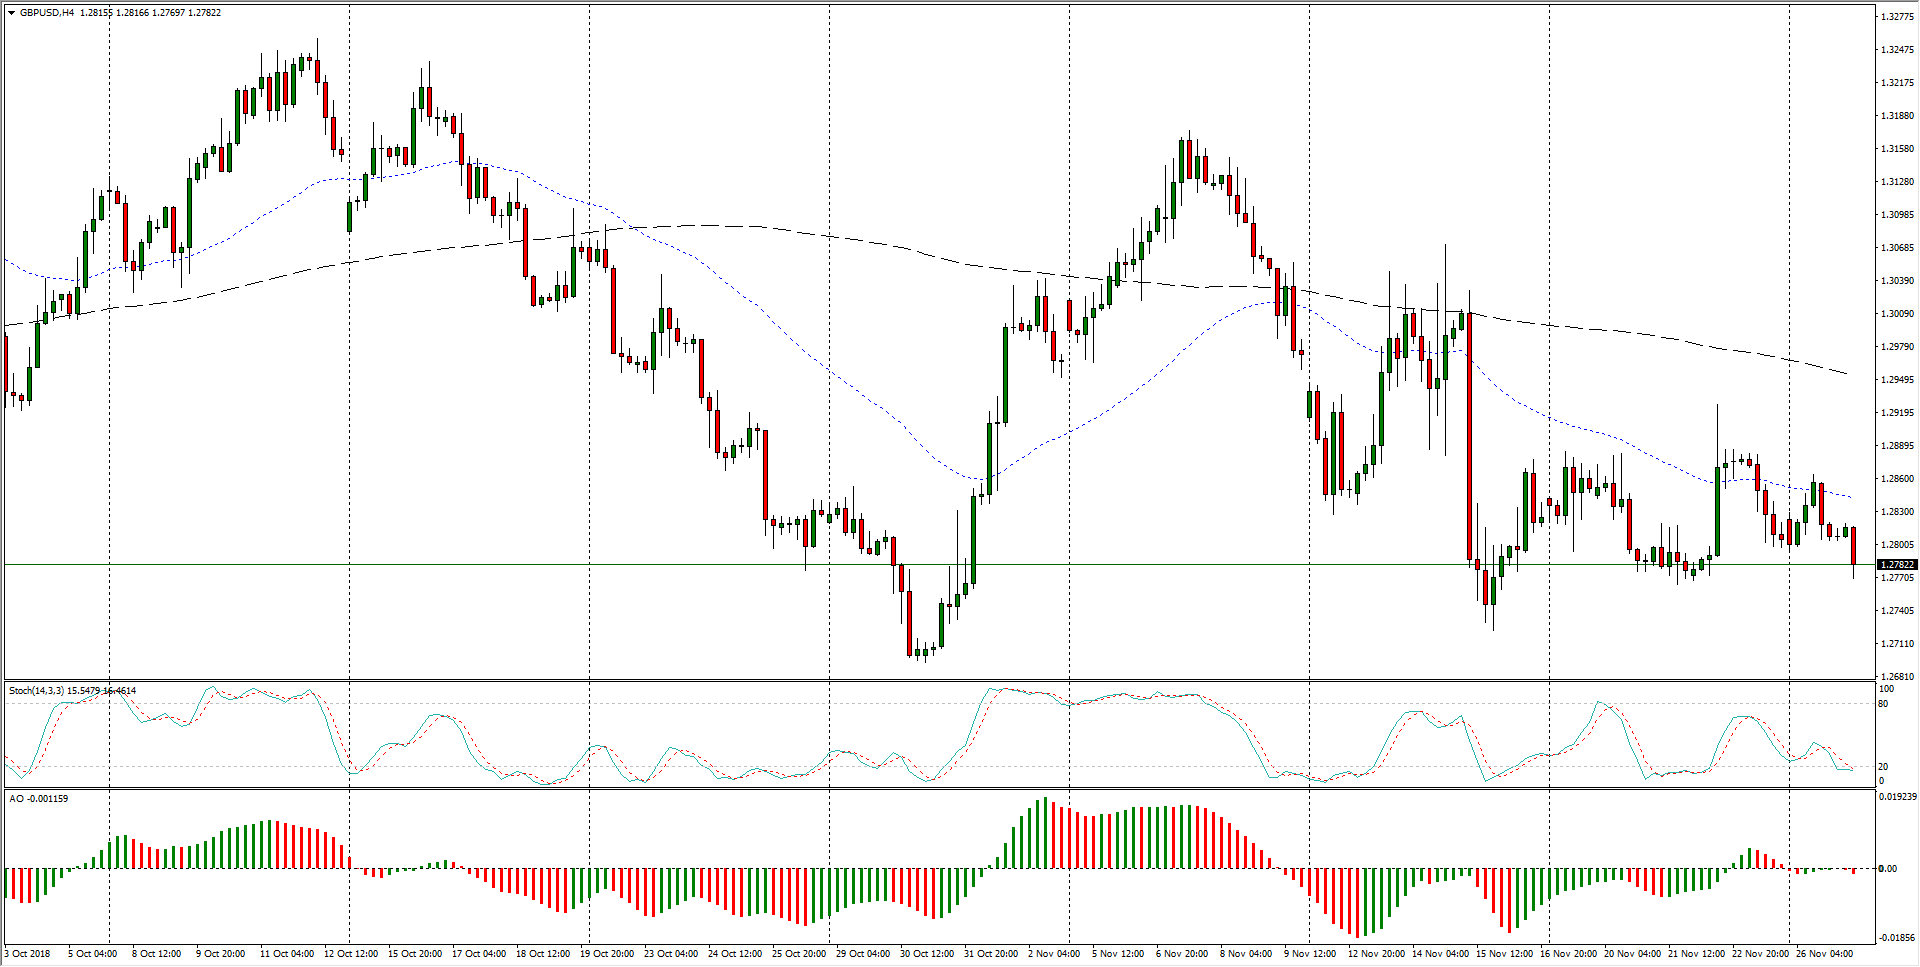
- Over the past month and a half, the Cable has found itself constrained within a tightening sideways triangle, and a break low will see GBP bears primed for a continued slide beyond October’s lows at the 1.2700 handle.
GBP/USD Chart, 4-Hour
GBP/USD
Overview:
Today Last Price: 1.2781
Today Daily change: -32 pips
Today Daily change %: -0.250%
Today Daily Open: 1.2813
Trends:
Previous Daily SMA20: 1.2905
Previous Daily SMA50: 1.3
Previous Daily SMA100: 1.2995
Previous Daily SMA200: 1.3341
Levels:
Previous Daily High: 1.2866
Previous Daily Low: 1.2796
Previous Weekly High: 1.2928
Previous Weekly Low: 1.2764
Previous Monthly High: 1.326
Previous Monthly Low: 1.2696
Previous Daily Fibonacci 38.2%: 1.2822
Previous Daily Fibonacci 61.8%: 1.2839
Previous Daily Pivot Point S1: 1.2784
Previous Daily Pivot Point S2: 1.2755
Previous Daily Pivot Point S3: 1.2714
Previous Daily Pivot Point R1: 1.2854
Previous Daily Pivot Point R2: 1.2894
Previous Daily Pivot Point R3: 1.2923
