- GBP/USD main bear trend has left place to a bullish channel since mid-August.
- GBP/USD is trading in a tight range between 1.2957 and just below the 1.3100 level. The 50 and 100-period simple moving average (SMA) have broken above the 200 SMA adding weight to the bullish case. The RSI and Stochastics are bullish. A sustained breakout above 1.3050 (August 30 swing high, key level) would open the gates to 1.3200 which was a key support/resistance in the past months.
- However, a bear breakout below 1.2800 would invalidate the bullish bias. The fundamental information this Thursday might unlock the situation on GBP/USD.
Thursday will see major fundamental information for GBP at 11.00 GMT with the Bank of England (BoE) interest rate decision and BoE minutes. Then the European Central Bank (ECB) Monetary policy statement and press conference at 12.30 GMT can indirectly affect GBP. Later in the day, the US Consumer Price Index (CPI) at 12.30 GMT is also expected to move the market a great deal. Fasten your seatbelt as there should be some volatility on GBP/USD this Thursday.
GBP/USD 4-hour chart
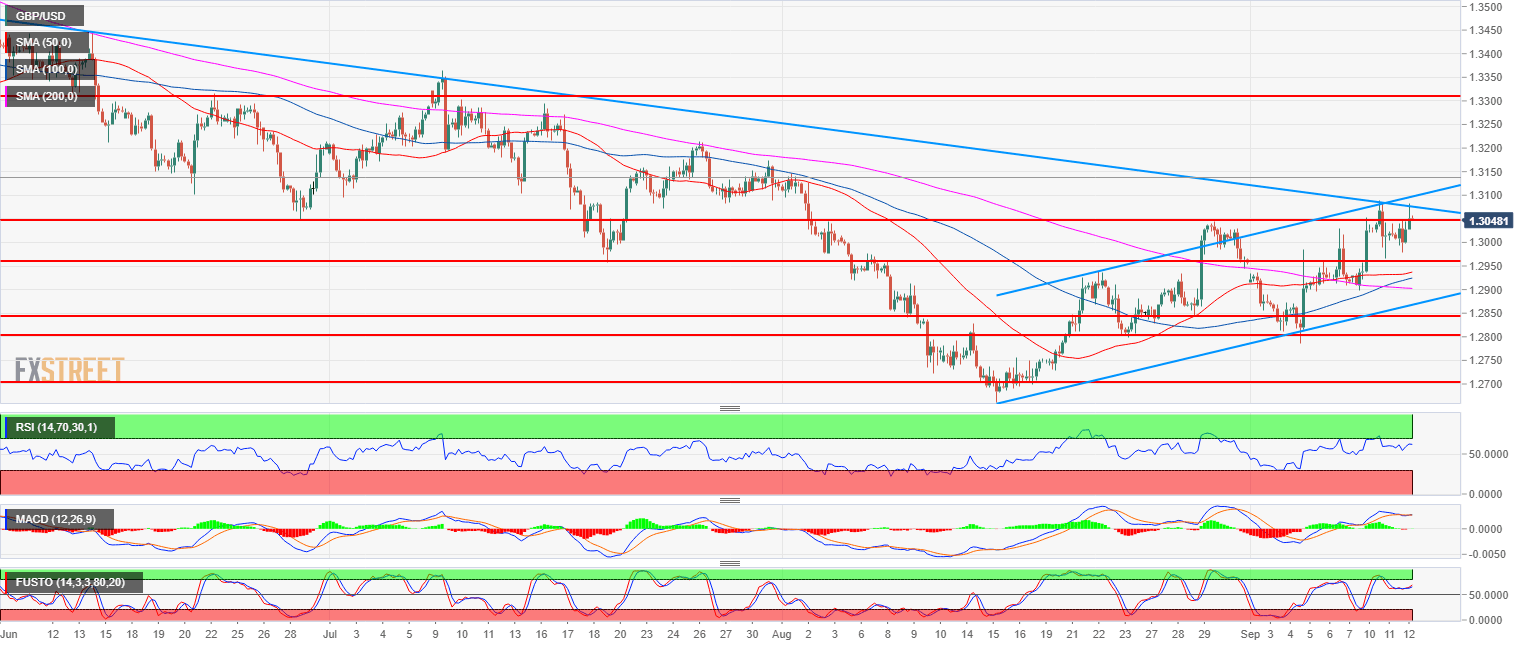
Spot rate: 1.3050
Relative change: 0.15%
High: 1.3082
Low: 1.2979
Main trend: Bearish
Short-term trend: Bullish above 1.2800
Resistance 1: 1.3050 August 30 swing high, key level
Resistance 2: 1.3082-1.3100 supply/demand level and figure
Resistance 3: 1.3200 figure (key support/resistance)
Resistance 4: 1.3300 figure
Support 1: 1.3000 figure
Support 2: 1.2957 July 19 swing low
Support 3: 1.2937 August 22 swing high
Support 4: 1.2900 figure
Support 5: 1.2868 August 22 low
Support 6: 1.2845, August 29 low
Support 7: 1.2800 August 24 swing low
