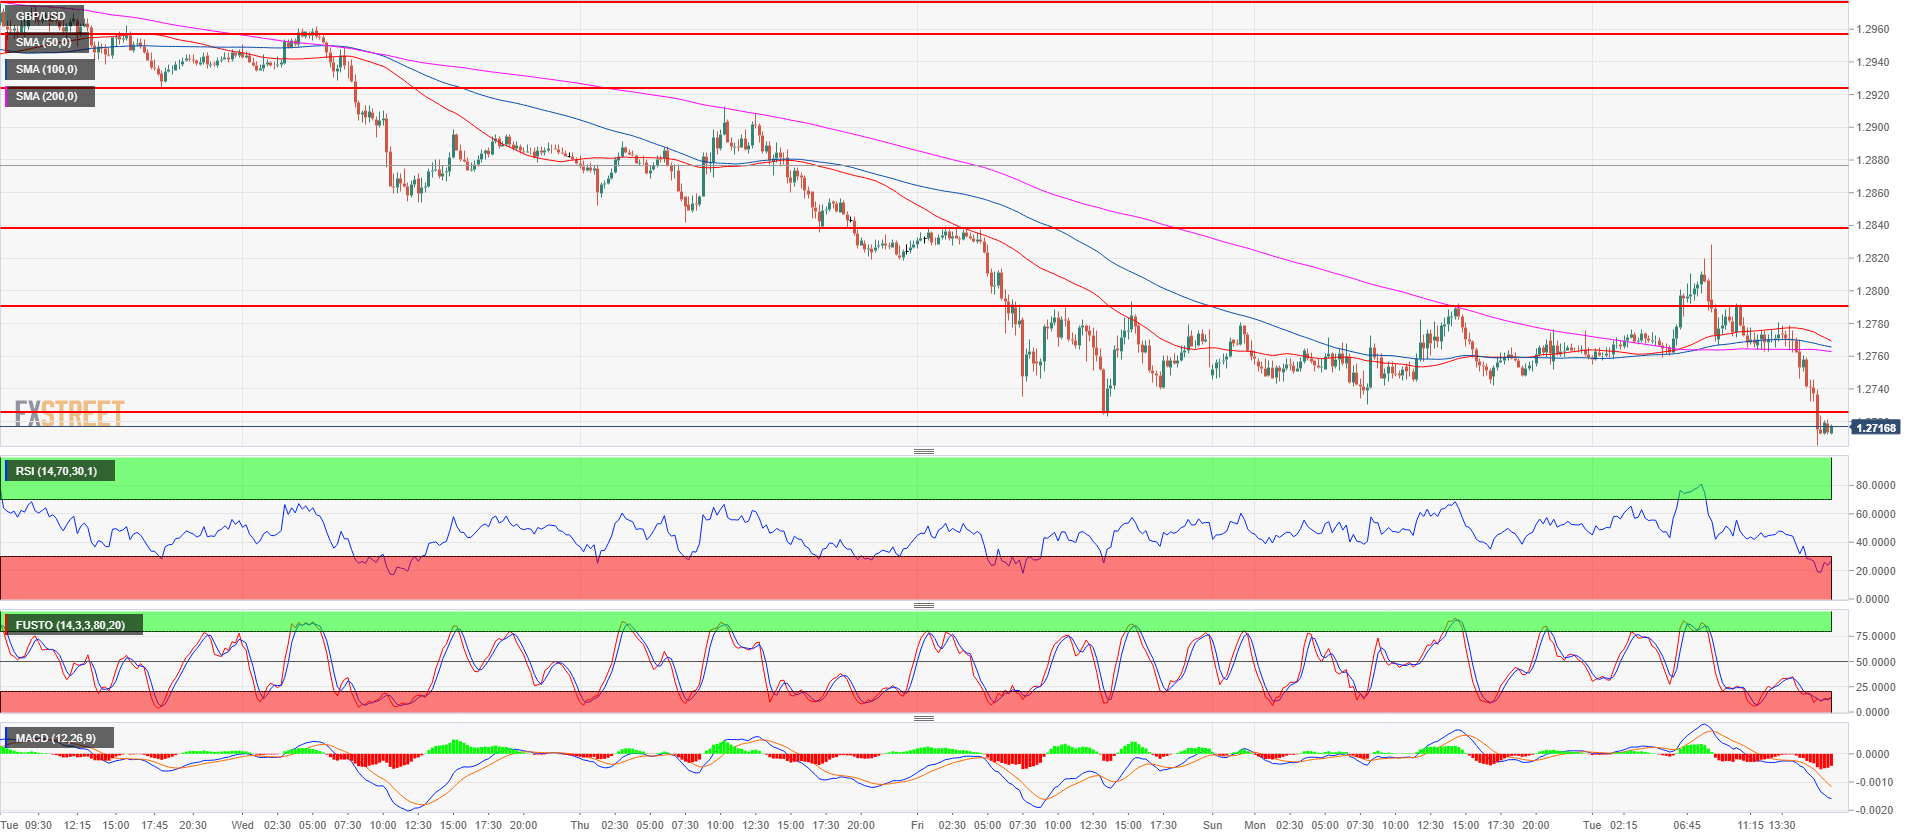
- GBP/USD dropped to a new 2018 low flirting with the 1.2700 figure. Bears should ideally keep the market below 1.2723 in order to keep the bear momentum intact.
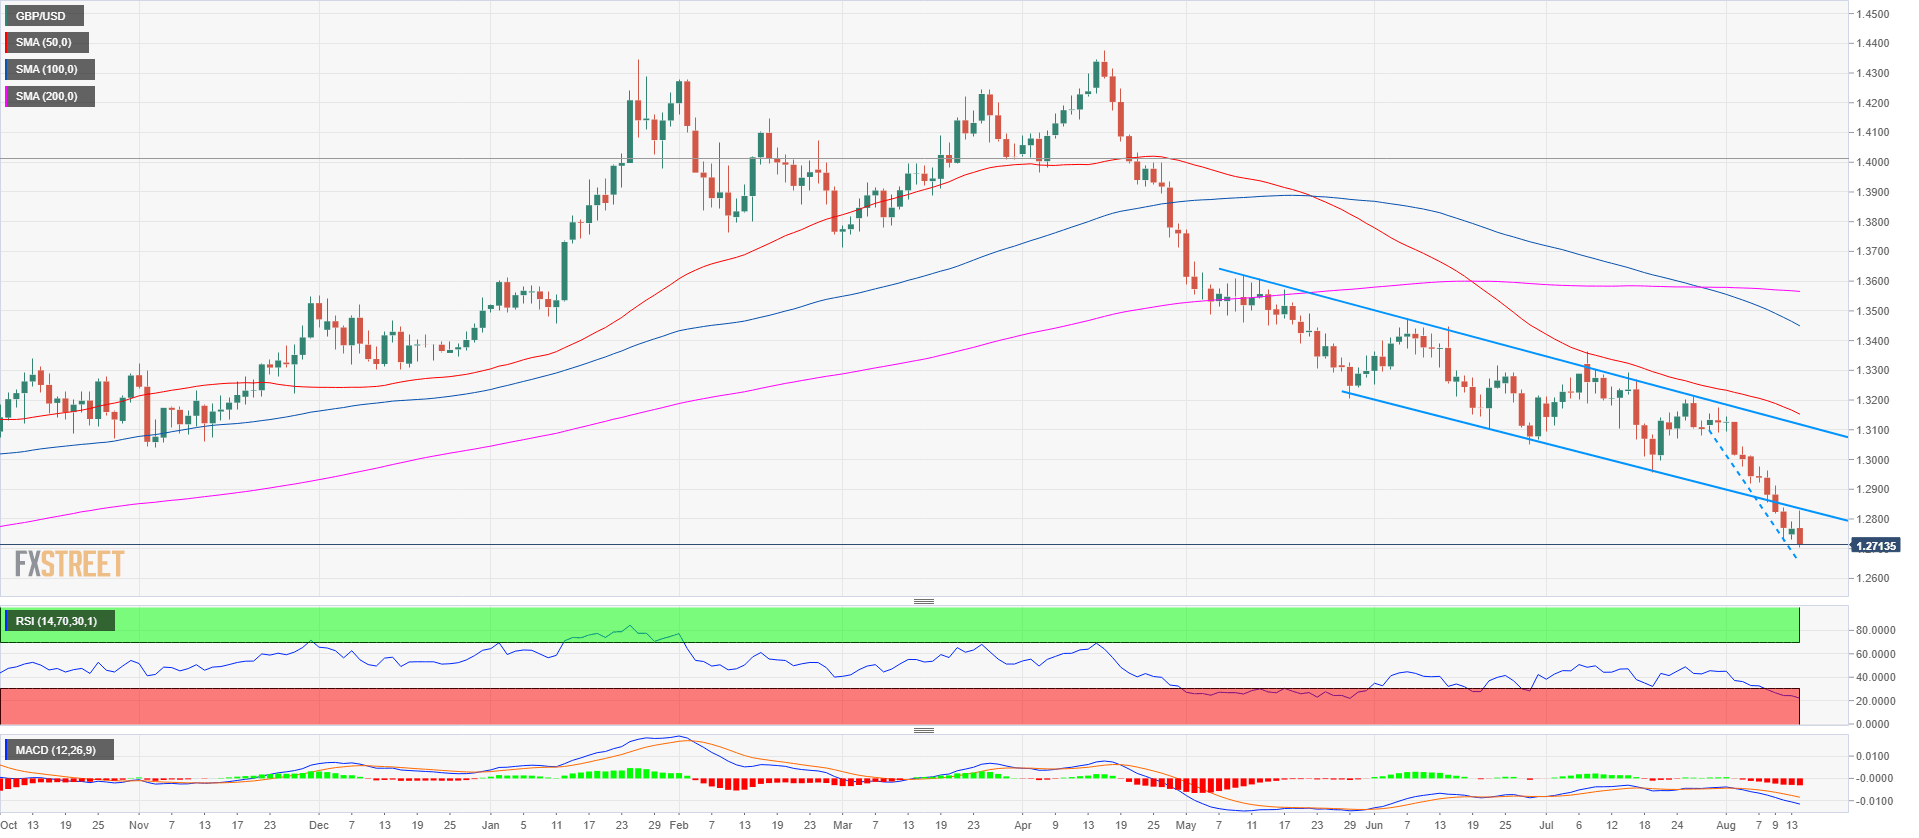
- GBP/USD bears next targets are located near the 1.2700 figure and 1.2589, June 21, 2017 low.
- Resistance is seen near 1.2723, August 10 low (former 2018 low) and 1.2789 intraday swing high.
GBP/USD 15-minute chart
GBP/USD daily chart
Spot rate: 1.2708
Relative change: -0.48%
High: 1.2828
Low: 1.2705
Trend: Bearish
Resistance 1: 1.2723, August 10 low
Resistance 2: 1.2789 intraday swing high
Resistance 3: 1.2838, August 10 high
Resistance 4: 1.2900-1.2923 area, figure and August 7 low
Support 1: 1.2700 figure
Support 2: 1.2589 June 21, 2017 low
Support 3: 1.2500 figure
