- GBP/USD fell about 45 pips in tandem with EUR/USD during the European Central Bank (ECB) press conference.
- GBP/USD is trying to break Wednesday’s low at 1.3129 as GBP/USD is trying to find support. GBP/USD bears broke below the bullish trendline and the 200-period simple moving average, however, they have not been able to reach the 1.3100 figure yet. The bulls are seeing this pullback as a new buying opportunity. However, a bear breakout below 1.3100 and 1.3076 current weekly low would not bode well for bulls.
GBP/USD 15-minute chart
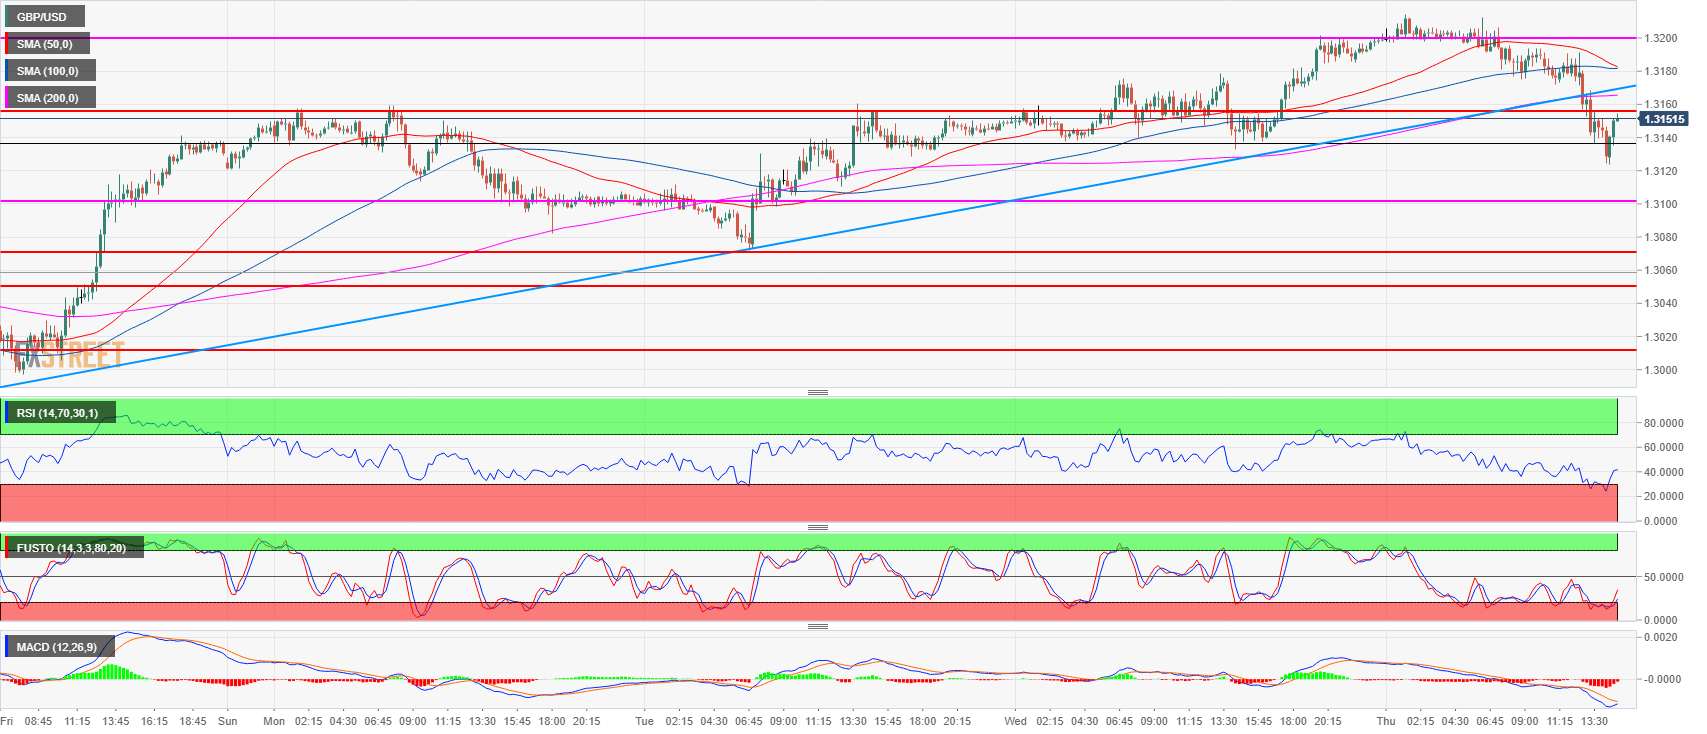
Spot rate: 1.3140
Relative change: -0.36%
High: 1.3214
Low: 1.3124
Trend: Bearish / Risk of bullish reversal above 1.3200
Resistance 1: 1.3155 former breakout point
Resistance 2: 1.3200 figure
Resistance 3: 1.3230 supply level
Resistance 4: 1.3250 June 4 high
Support 1: 1.3100-1.3076 area, figure and weekly low
Support 2: 1.3049 June 28 low
Support 3: 1.3010 July 18 low
Support 4: 1.2957 current 2018 low
Support 5: 1.2908 September 5, 2017 low
