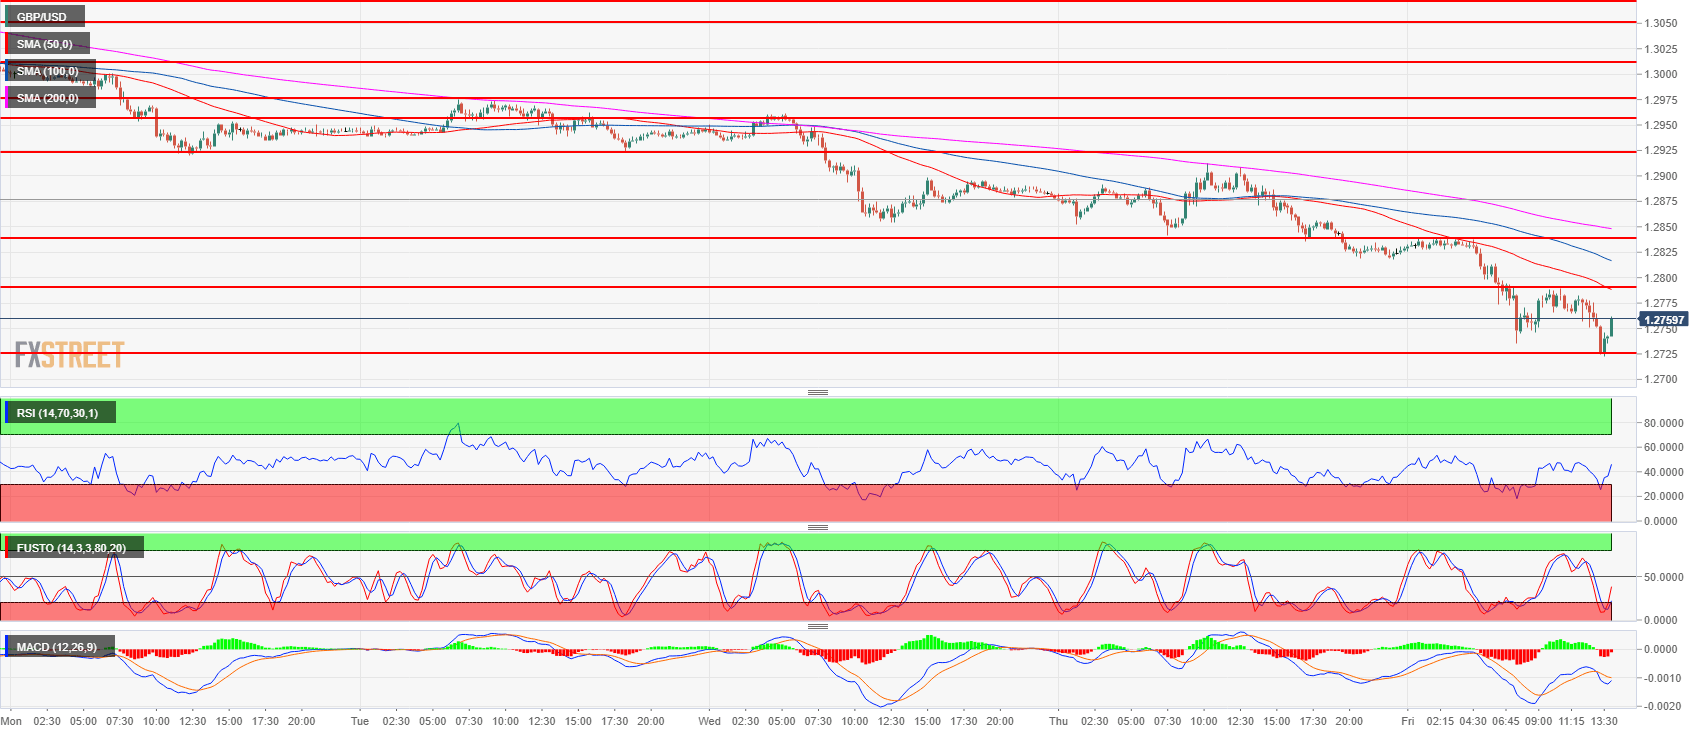
- GBP/USD is falling fast to new 2018 lows as GBP/USD broke below the 1.2800 psychological level.
- The next targets to the downside are likely located near the 1.2700 figure and 1.2589 June 21, 2017 low.
- Near-term resistances to the upside are seen near 1.2789 intraday swing high and 1.2838, August 10 high.
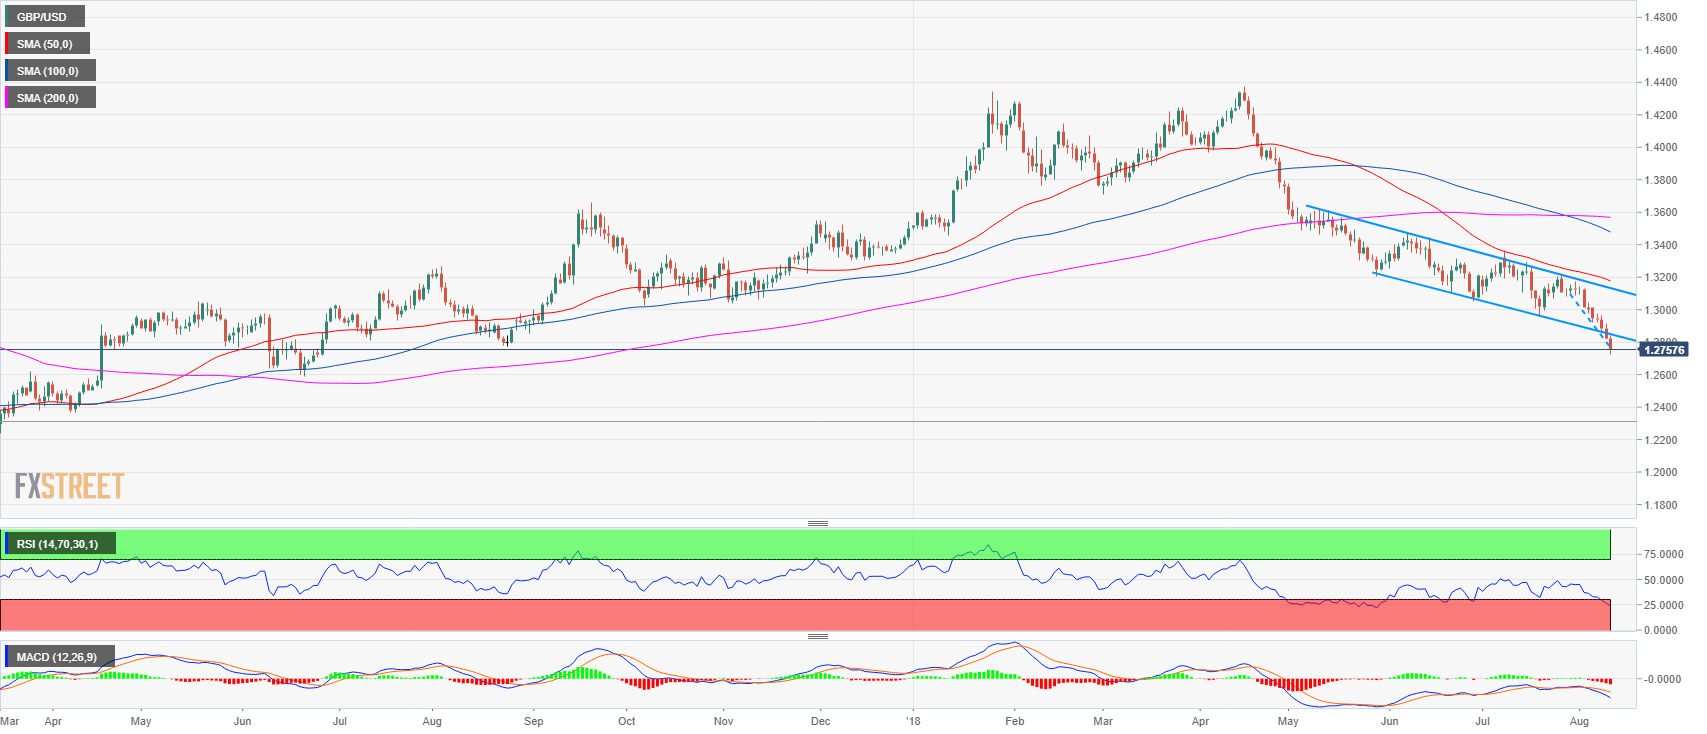
GBP/USD daily chart
Spot rate: 1.2760
Relative change: -0.50%
High: 1.2838
Low: 1.2723
Trend: Bearish
Resistance 1: 1.2789 intraday swing high
Resistance 2: 1.2838, August 10 high
Resistance 3: 1.2900-1.2923 area, figure and August 7 low
Resistance 4: 1.2957 July 17 low
Resistance 5: 1.2975 August 3 low
Resistance 6: 1.3000-1.3010 area, figure and July 18 low
Resistance 7: 1.3049 June 28 low
Resistance 8: 1.3100-1.3076 area, figure and July 24 low
Resistance 9: 1.3155 former breakout point
Resistance 10: 1.3200 figure
Resistance 11: 1.3230 supply level
Resistance 12: 1.3250 June 4 high
Support 1: 1.2723, current 2018 low
Support 2: 1.2700 figure
Support 3: 1.2589 June 21, 2017 low
