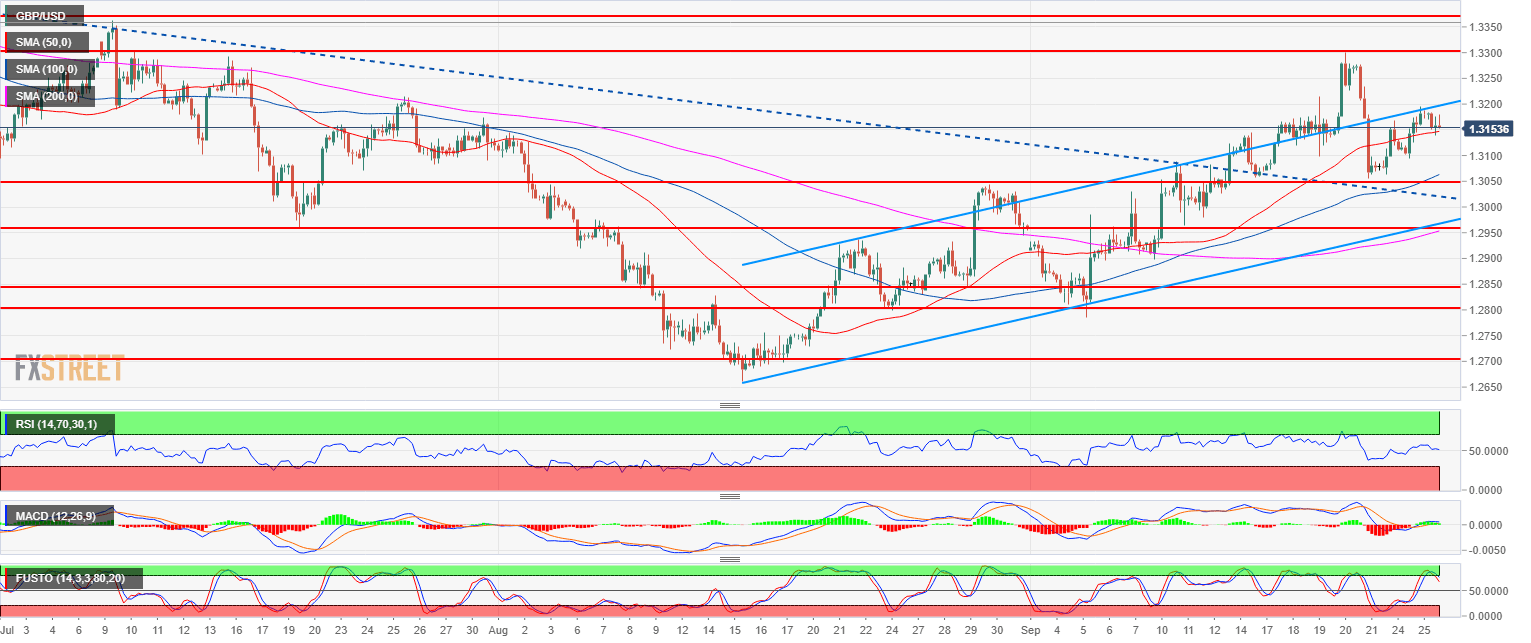
- GBP/USD main bear trend has been on halt since mid-August as the bulls managed to bring the currency pair above the 50-day simple moving average.
- GBP/USD is weakening as bulls are having a hard time to break above the 1.3200 figure. The RSI, MACD and Stochastics are decelerating suggesting the current bull trend might be entering a pullback down.
- Supports to the downside are seen near 1.3100 and 1.3050 August 30 swing high and key level.
Spot rate: 1.3154
Relative change: -0.19%
High: 1.3187
Low: 1.3138
Main trend: Bullish above 1.3200
Resistance 1: 1.3200 figure (key support/resistance)
Resistance 2: 1.3300 figure
Resistance 3: 1.3363 July high
Resistance 4: 1.3472 June 7 high
Support 1: 1.3144 key level
Support 2: 1.3100 figure
Support 3: 1.3050 August 30 swing high, key level
Support 4: 1.3000 figure
Support 5: 1.2957 July 19 swing low
