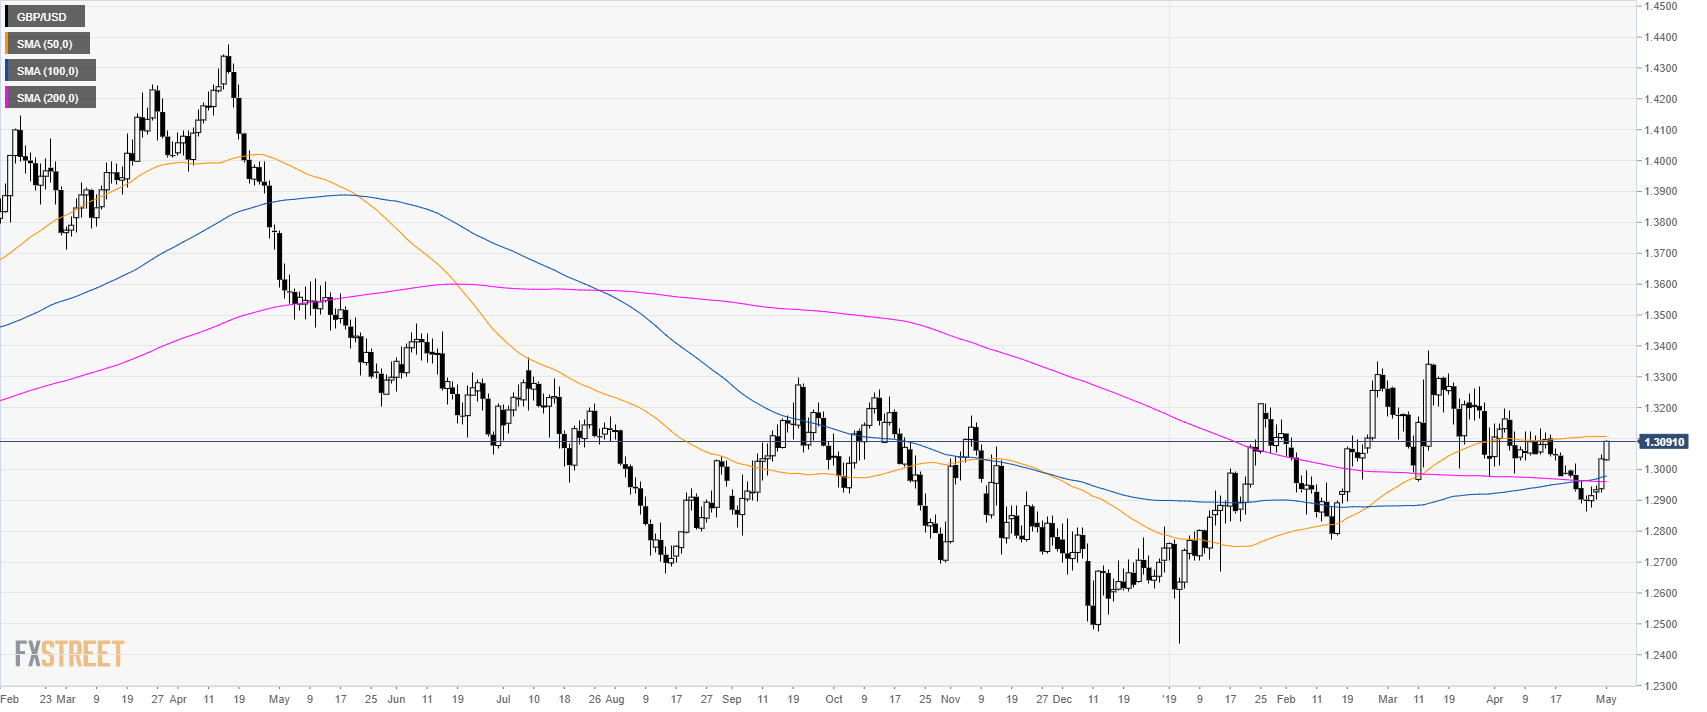
GBP/USD daily chart
- GBP/USD is trading above its 100 and 200 SMAs as the market is pushing up for the 5th day in a row.
-
Investors will closely be watching the Federal Reserve Monetary Policy Statement at 18:00 GMT.
GBP/USD 4-hour chart
- GBP/USD is trading above the main SMAs suggesting bullish momentum in the medium-term.
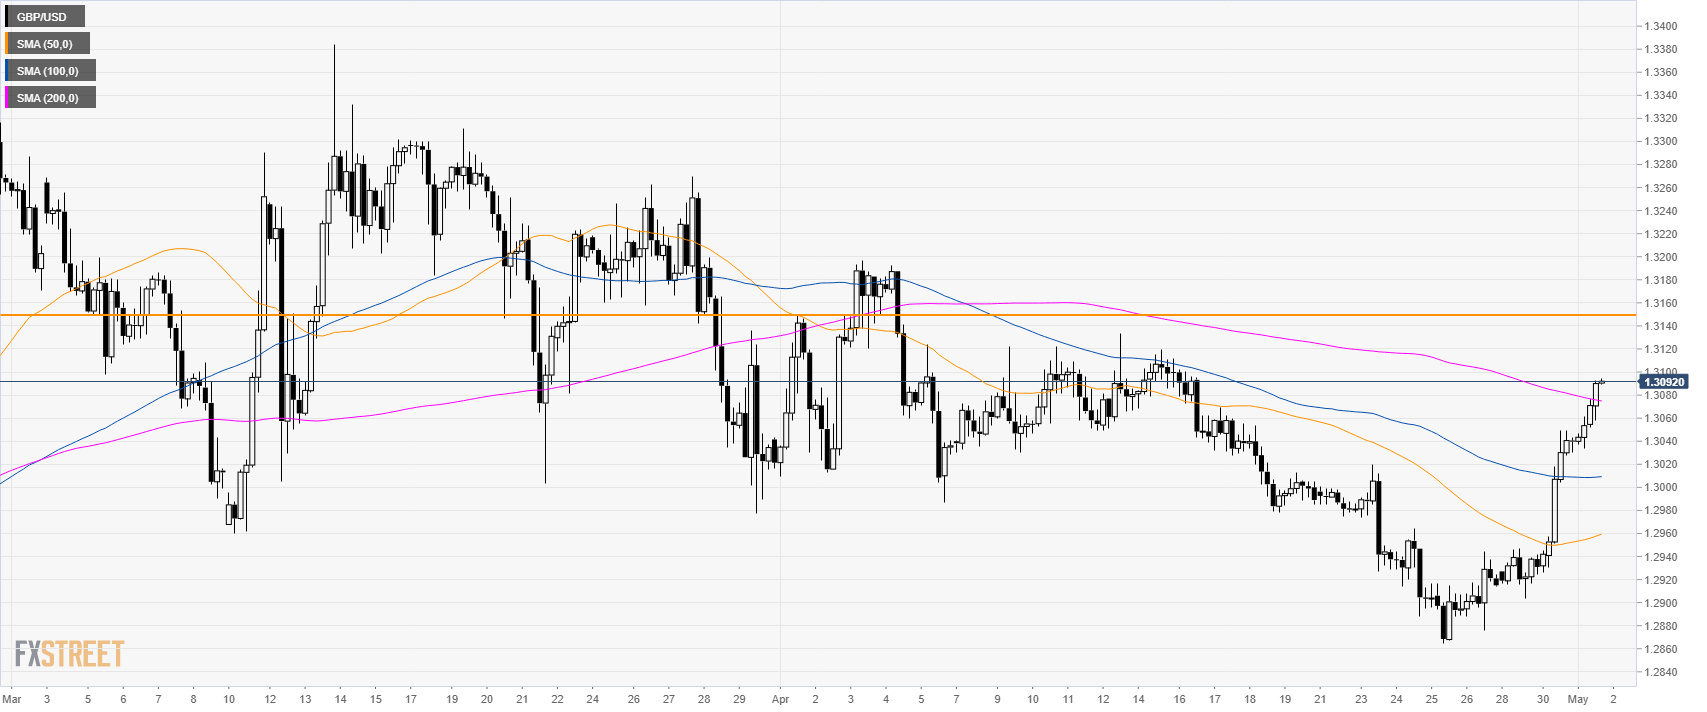
GBP/USD 30-minute chart
- GBP/USD is trading above its main SMAs suggesting a bullish bias in the short-term.
- Buyers are being relentless and if they break 1.3100 figure then 1.3150 can become the next target.
- Looking down, support is at 1.3050 and 1.3000 level.

Additional key levels
