- USD is weakening accross the board as the trade war is triggering the risk-off mood in the markets.
- The key 1.2600 figure is currently holding.
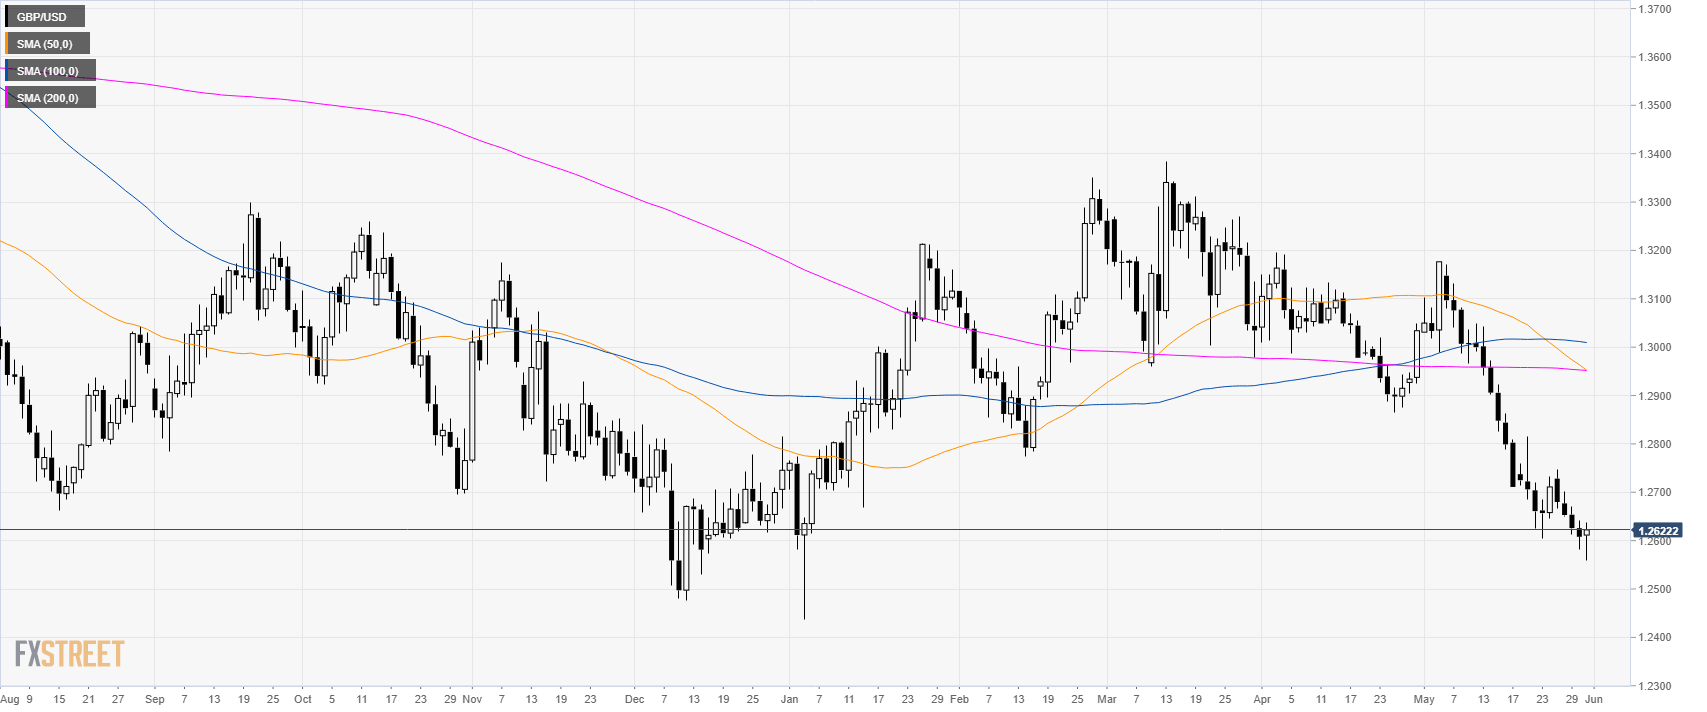
GBP/USD daily chart
GBP/USD is attempting to stabilize above the 1.2600 figure while it is trading below its main simple moving averages (SMAs).
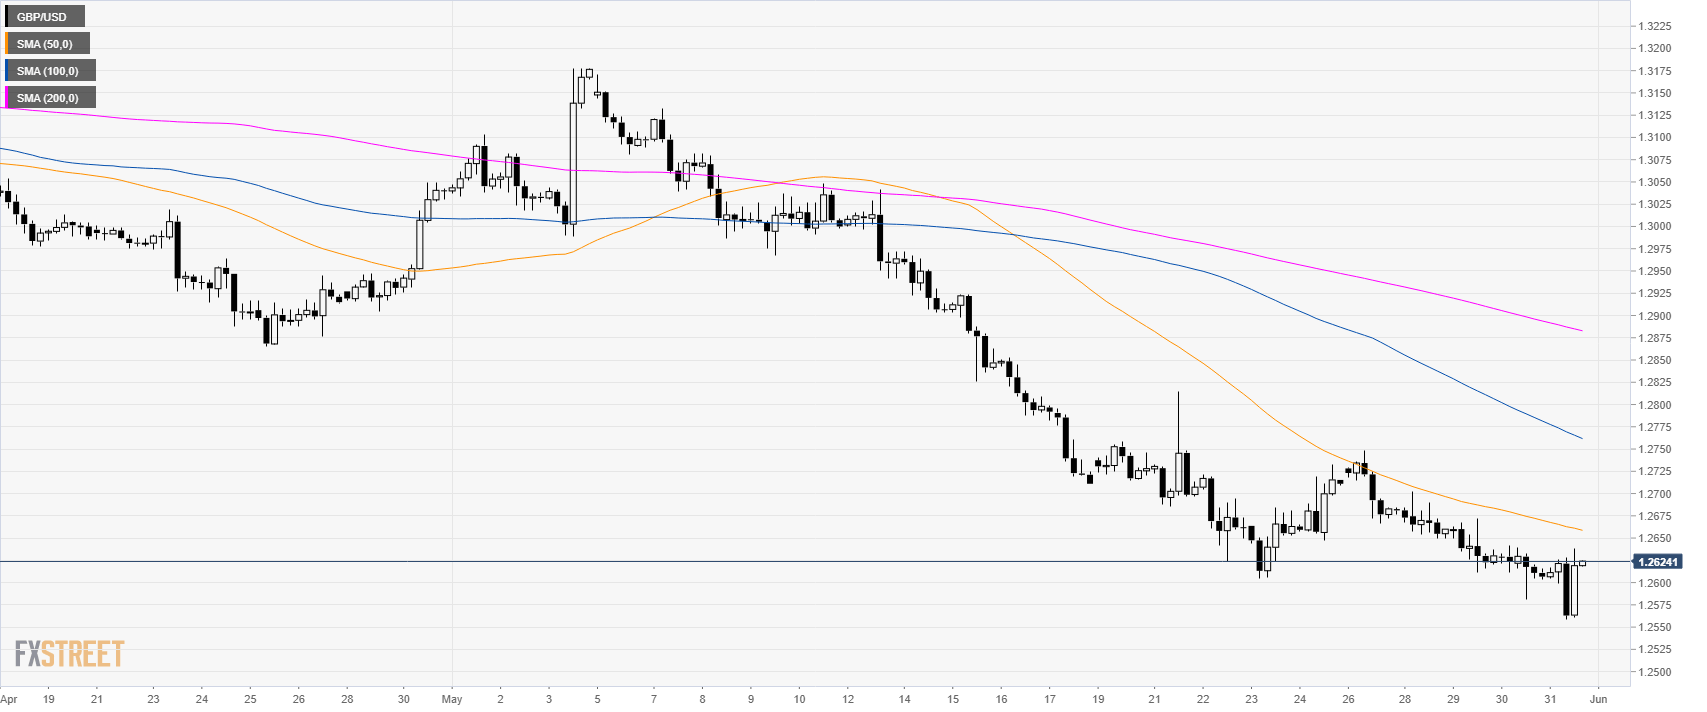
GBP/USD 4-hour chart
Cable remain under bearish pressure as the market trades below
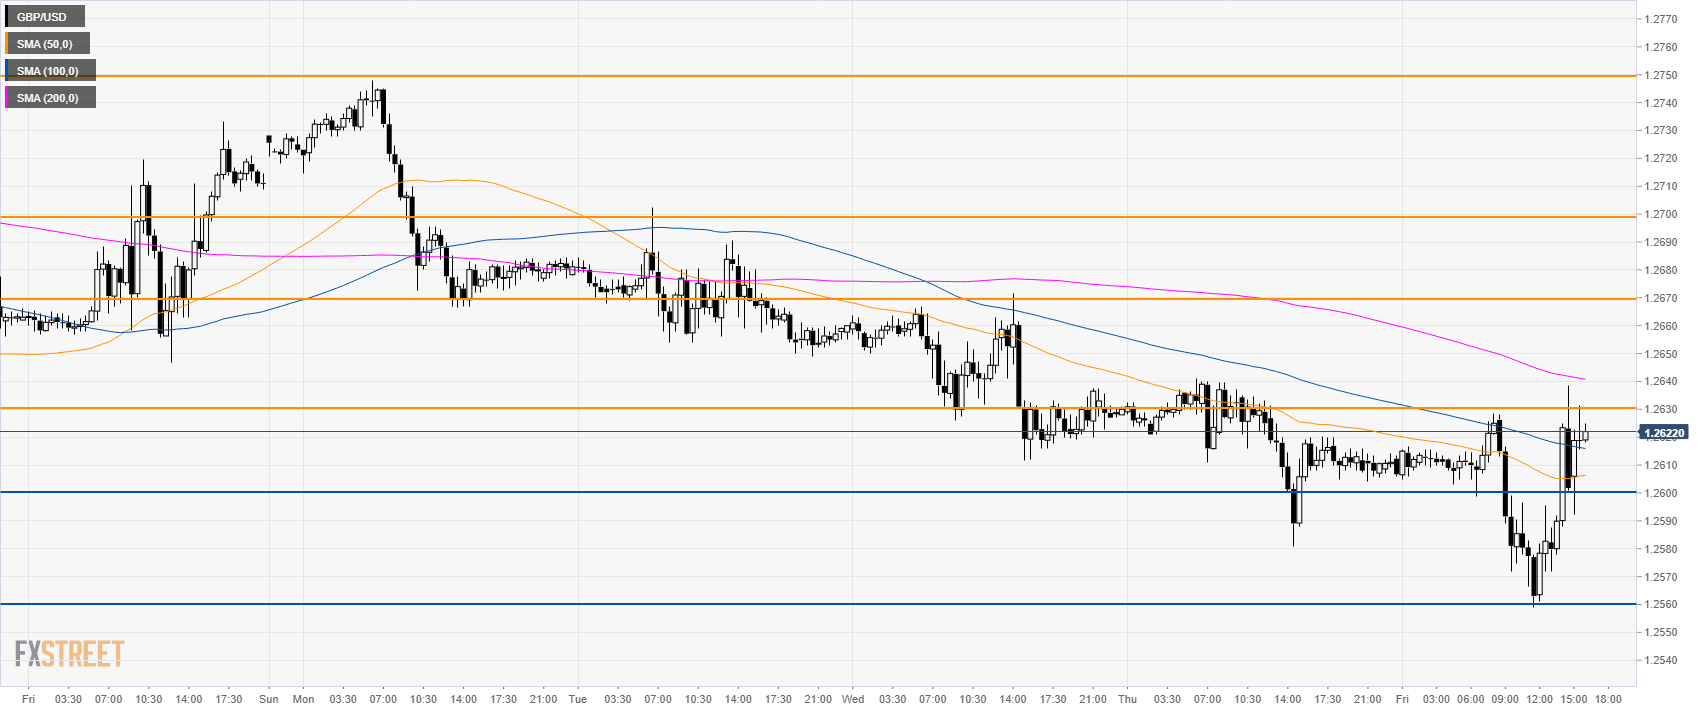
GBP/USD 30-minute chart
GBP/USD is trading back above 1.2600 as the market tested 1.2630 and the 200 SMA. The key resistance to break for bulls is 1.2630. After comes 1.2670 and the 1.2700 figure. A daily close below 1.2600 could open the gates to a new bear leg.
Additional key levels
