- The pair extended overnight late pullback from the 1.2900 mark.
- The intraday slide showed some resilience below the 100-hour SMA.
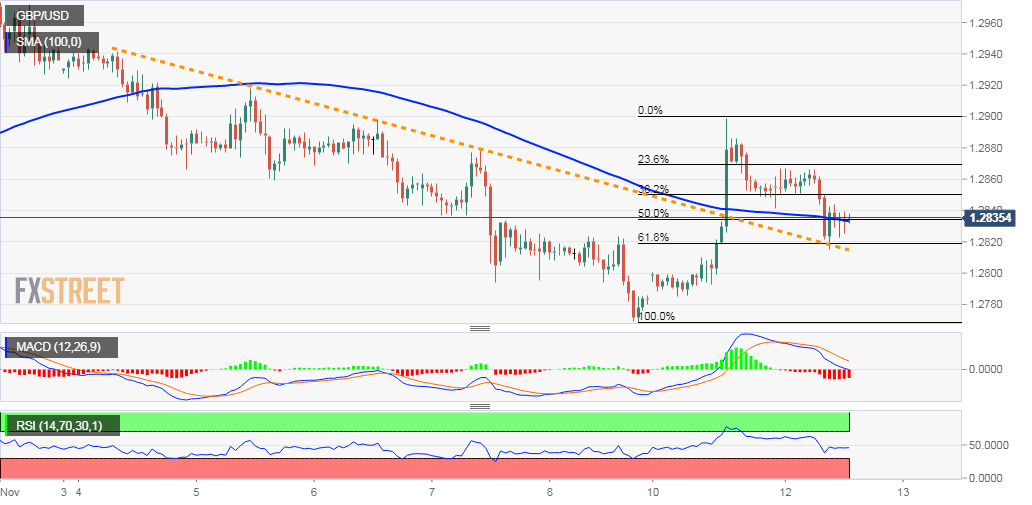
The GBP/USD pair extended previous session’s pullback from the 1.2900 neighbourhood and witnessed some follow-through selling on Tuesday. The pair, however, showed some resilience below 100-hour SMA and managed to find some support near a one-week-old descending trend-line resistance breakpoint, around the 1.2820 area.
The mentioned region coincides with 61.8% Fibonacci level of the 1.2769-1.2899 latest upsurge and should now act as a key pivotal point for short-term traders. Meanwhile, mixed technical indicators on hourly/daily charts haven’t been supportive of any firm near-term direction and thus, warrant some caution before placing aggressive bets.
Bulls are likely to wait for a sustained move beyond the 1.2900 handle before positioning for a further near-term appreciating move towards an intermediate resistance near the 1.2965-70 region. The momentum could further get extended and assist the pair to aim back towards reclaiming the key 1.30 psychological mark.
On the flip side, weakness below the mentioned resistance-turned-support might now turn the pair vulnerable to slide further below the 1.2800 handle towards retesting multi-week lows, around the 1.2770-65 region. Some follow-through selling has the potential to drag the pair further towards its next major support near the 1.2715-10 zone.
GBP/USD 1-hourly chart