- GBP/USD trades little weak around 1.2980 during early Monday.
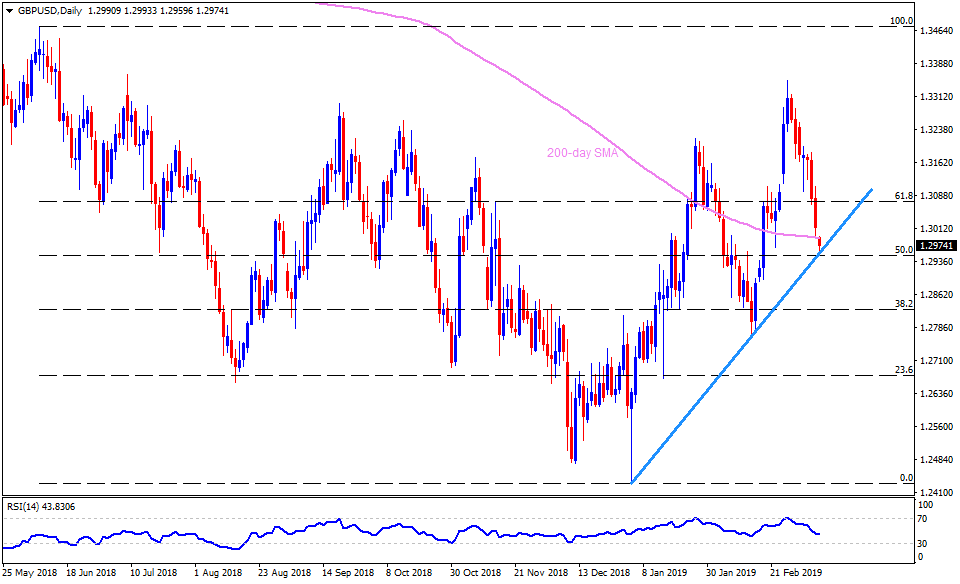
- The pair slipped beneath 200-day simple moving average (SMA) but couldn’t decline much under immediate ascending support-line joining January low to February ones.
- As a result, 1.2950 – 1.2990 area seems restricting the movement ahead of the London market open.
- Should the quote dips below 1.2950, 1.2900, 38.2% Fibonacci retracement of June 2018-January 2019 slide, at 1.2830 and February low near 1.2770 can gain sellers’ attention.
- In a case prices rally beyond 1.2990 SMA resistance, a break of 1.3000 can work as a validation to additional rise towards 61.8% Fibonacci retracement near 1.3075/80.
- Also, the pair’s successful rise above 1.3080 could favor optimists to target 1.3180.
GBP/USD daily chart
Additional important levels:
Overview:
Today Last Price: 1.2977
Today Daily change: -36 pips
Today Daily change %: -0.28%
Today Daily Open: 1.3013
Trends:
Daily SMA20: 1.3059
Daily SMA50: 1.2972
Daily SMA100: 1.2882
Daily SMA200: 1.2987
Levels:
Previous Daily High: 1.3109
Previous Daily Low: 1.299
Previous Weekly High: 1.3269
Previous Weekly Low: 1.299
Previous Monthly High: 1.3351
Previous Monthly Low: 1.2773
Daily Fibonacci 38.2%: 1.3035
Daily Fibonacci 61.8%: 1.3063
Daily Pivot Point S1: 1.2966
Daily Pivot Point S2: 1.2919
Daily Pivot Point S3: 1.2847
Daily Pivot Point R1: 1.3084
Daily Pivot Point R2: 1.3156
Daily Pivot Point R3: 1.3203
