- The Sterling is breaking above the August highs.
- The broad-based USD weakness also supports GBP/USD strength.
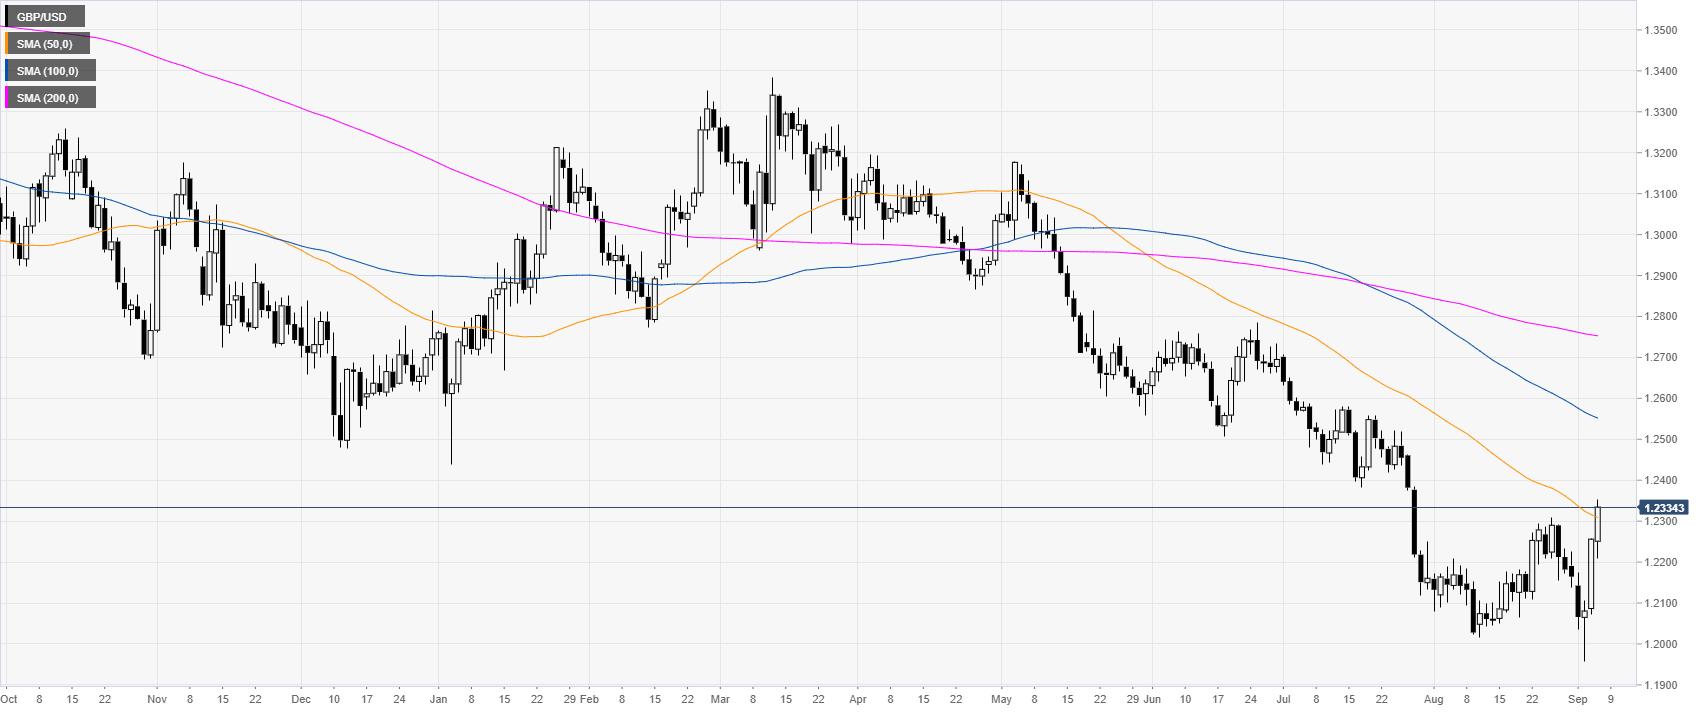
GBP/USD daily chart
The GBP/USD currency pair is in a bear trend below the 100 and 200-day simple moving averages (SMAs). However, the Sterling is rebounding sharply from multi-year lows as the bill to block a no-deal Brexit passed the House of Commons. Additionally, the broad-based US Dollar weakness is adding to the GBP/USD strength.
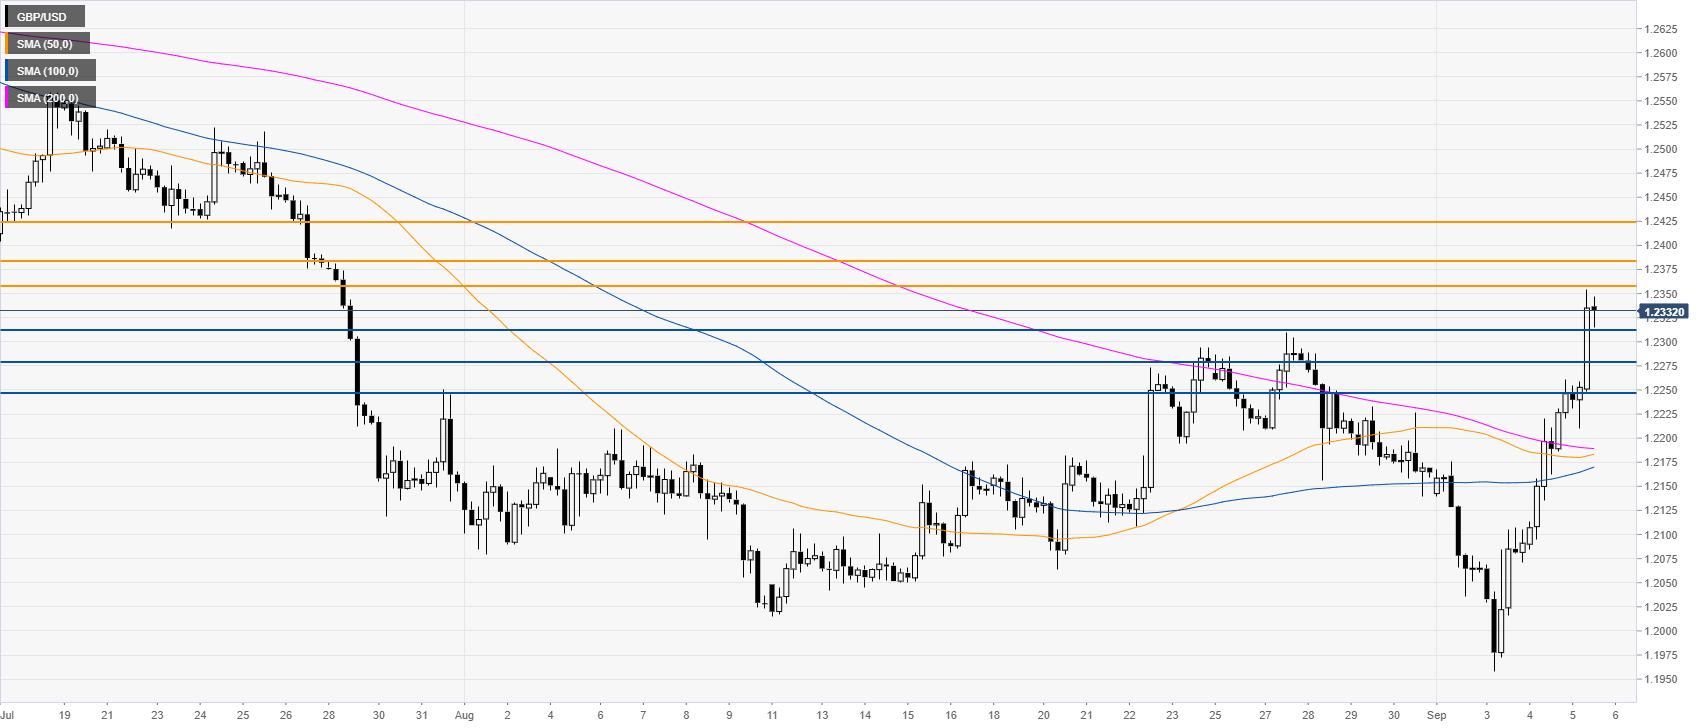
GBP/USD 4-hour chart
GBP/USD is challenging the 1.2348 level as the market is trading above the main SMAs. If buyers overcome 1.2348, the market is set to move up towards 1.2384 and 1.2422 resistance levels, according to the Technical Confluences Indicator.
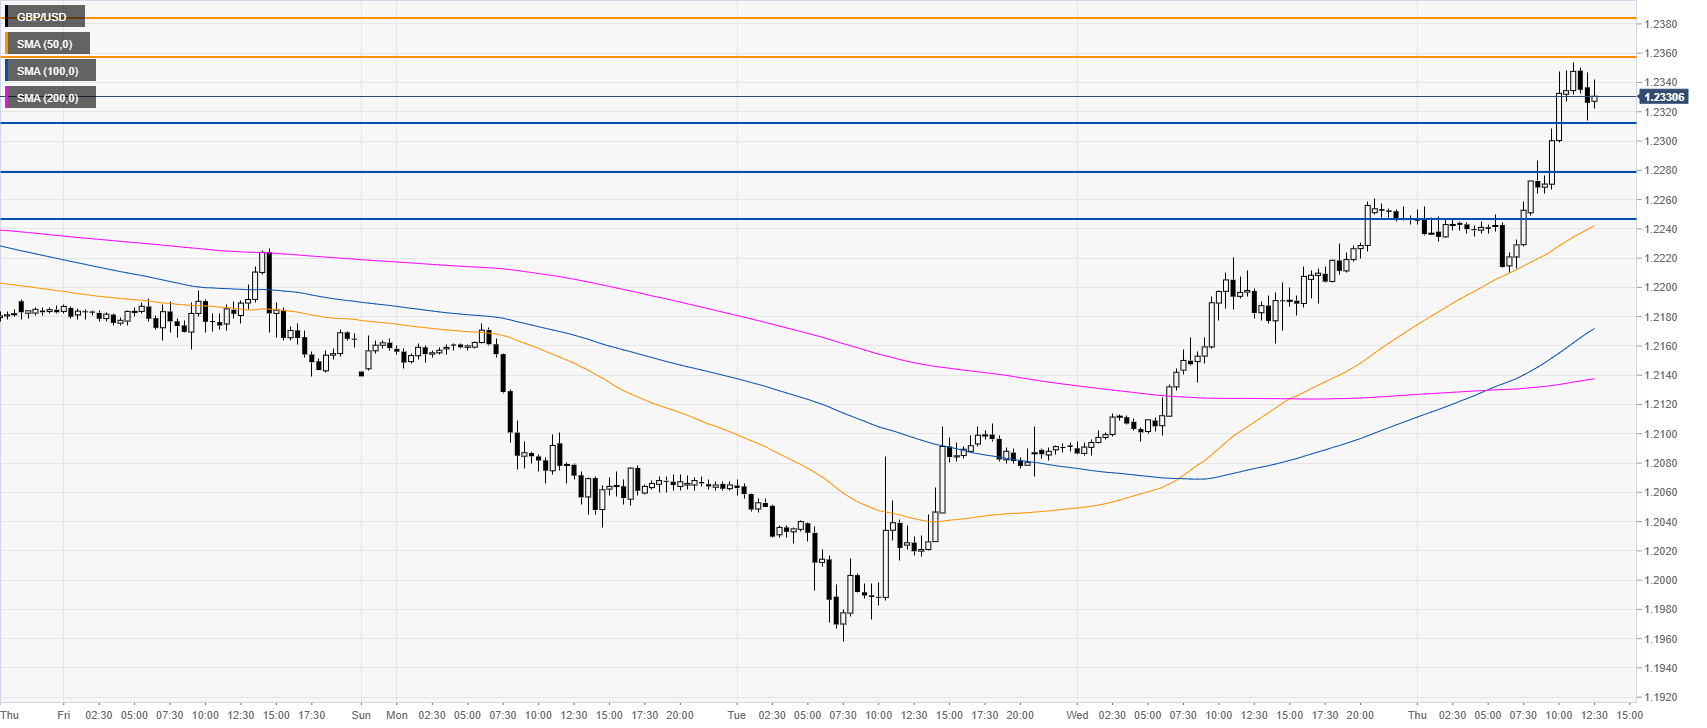
GBP/USD 30-minute chart
GBP/USD is trading near its daily highs while above the main SMAs, suggesting bullish momentum in the near term. Immediate support can be seen at 1.2312, 1.2281 and 1.2243 levels, according to the Technical Confluences Indicator.
Additional key levels
