- GBP/USD remains choppy since the week-start.
- A seven-day-old descending trend-line adds to the resistance beyond the current range.
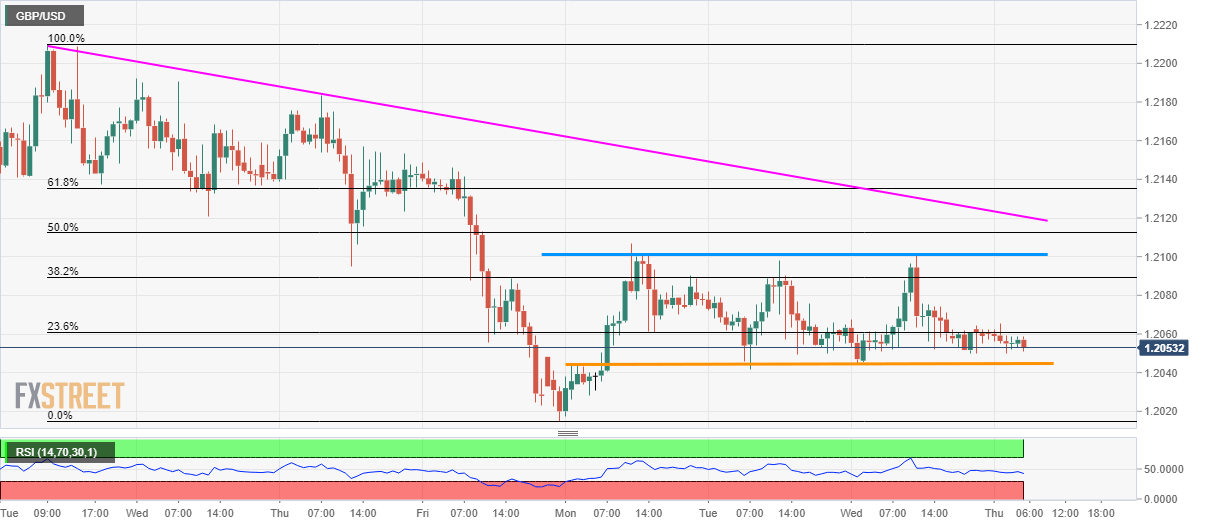
GBP/USD maintains the 60-pip range, active since early-week, while taking rounds to 1.2050 ahead of the UK session on Thursday.
Portraying the move, 14-bar relative strength index also flashes normal trade condition, signaling inaction that requires either side break of the range.
Presently, the quote declines towards 1.2040 support, which if broken can quickly fetch it to 1.2015 and then to the 2017 low around 1.1987.
On the upside, 1.2100 and a downward sloping trend-line since August 06 at 1.2120 limits the pair’s near term advances.
If buyers sneak in around 1.2120, August 08 high near 1.2183 will appear on their radar.
GBP/USD hourly chart
Trend: Sideways
