- Back-to-back Doji candlesticks portray GBP/USD traders’ indecision.
- Bearish MACD, gradual weakness keeps sellers hopeful.
With the consecutive two Doji formations of the GBP/USD pair’s daily chart, the quote portrays traders’ indecision while taking rounds to 1.2850 amid Thursday’s Asian session.
Bearish signals from 12-bar Moving Average Convergence and Divergence (MACD), failure to cross 21-day Simple Moving Average (SMA) and a gradual downpour since October 21 favors the sellers.
However, the quote declines below 23.6% Fibonacci retracement of September-October upside, at 1.2765, become necessary to aim for 1.2700 and September month high near 1.2580.
Alternatively, pair’s upside clearance of 21-day SMA, at 1.2877 now, can propel prices to monthly top surrounding 1.2975 whereas 1.3000 and the October month high around 1.3015 could question bulls afterward.
GBP/USD daily chart
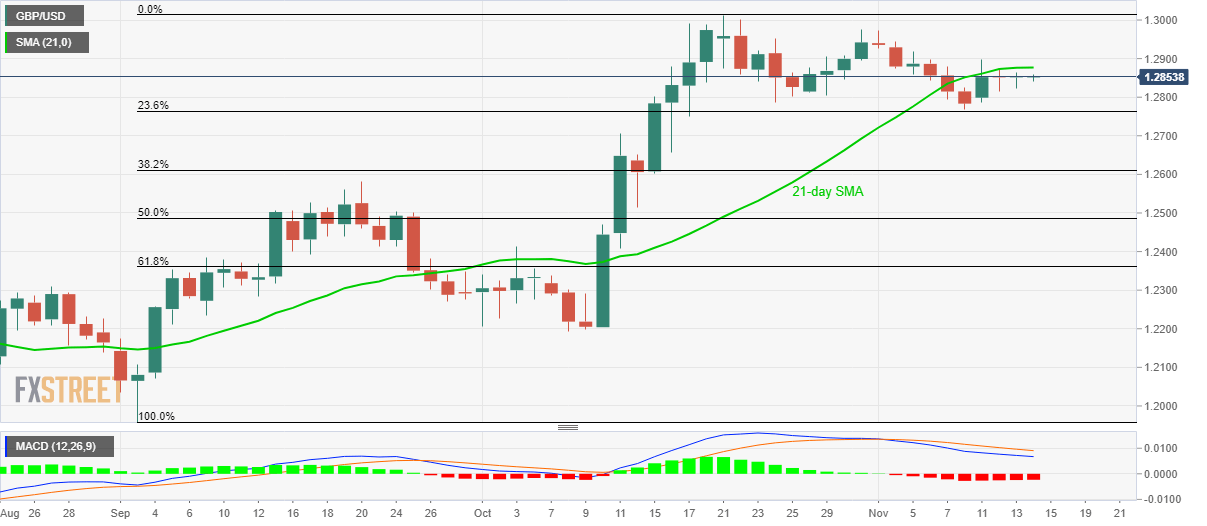
Trend: Sideways
