- GBP/USD holds weakness below 23.6% Fibonacci retracement but stays above immediate support-line.
- With MACD likely recovering, four-day-old resistance-line gain market attention.
Although prices remain below 23.6% Fibonacci retracement of latest declines, GBP/USD holds firm above two-day-old support-line as it trades near 1.2055 while heading into the UK markets’ open on Wednesday.
Also supporting the odds of upside is 12-bar moving average convergence and divergence (MACD) that is slowly inching closer to positive territory.
In doing so, the quote can run-up beyond 23.6% Fibonacci retracement level of 1.2061 while targeting near-term descending trend-line, at 1.2080.
Should there be increased rise above 1.2080, Monday’s high around 1.2107 and 61.8% Fibonacci retracement of 1.2136 can become buyers’ favorites.
If at all sellers take over, 1.2015 and 1.2000 can be their aims prior to looking at the 2017 low near 1.1987 and 2016 bottom near 1.1800.
GBP/USD hourly chart
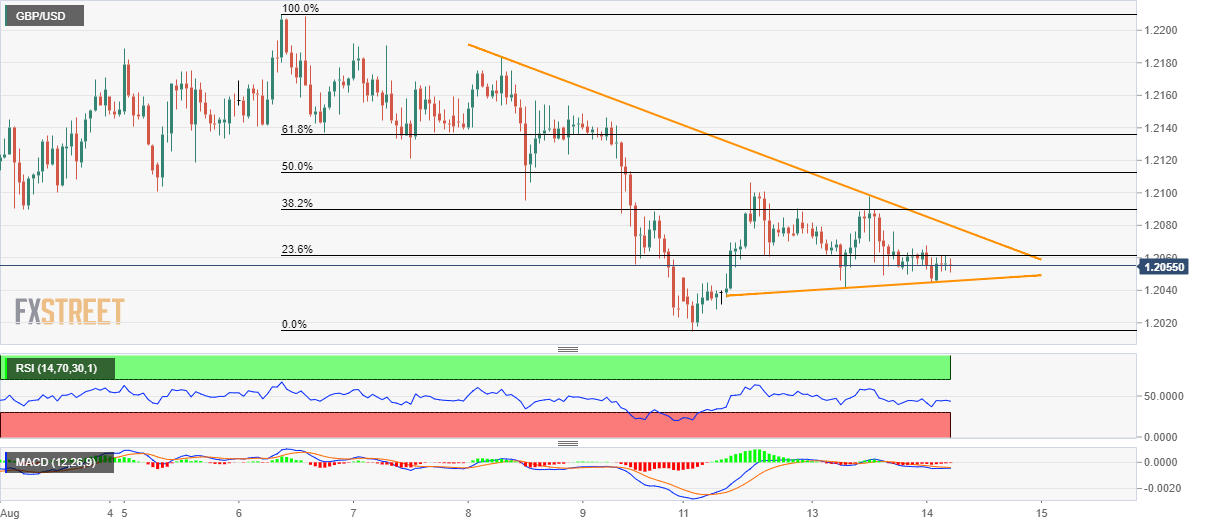
Trend: Pullback expected
