- GBP/USD has charted a lower high despite the bull divergence of the RSI.
- The pair risks falling to recent lows below 1.26.
GBP/USD seems to have charted a bearish lower high around 1.2750 and could revisit recent lows below 1.26.
The currency pair is currently trading at 1.2676, representing little change on the day.
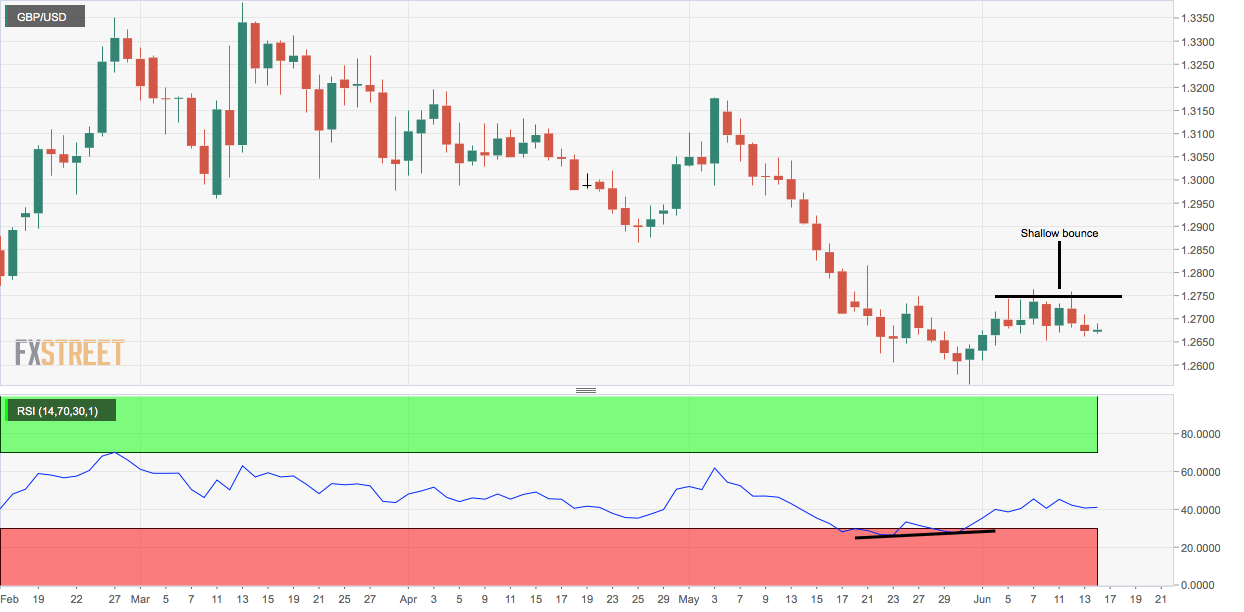
Cable picked up a bid at 1.2559 on May 31, confirming a bullish divergence of the 14-day relative strength index (RSI).
The subsequent move higher was shallow with the pair repeatedly struggling to cross 1.2740-1.2760 range in six days to June 12 before falling back below 1.26 on Thursday.
The pair’s inability to post sustainable corrective rally despite the bullish divergence of the RSI indicates the bearish sentiment is still quite strong and now with a bearish lower high in place, a retest of 1.2559 looks likely.
A daily close above the June 7 high of 1.2763 is needed to invalidate the bearish setup.
Daily chart
Trend: Bearish
Technical levels
