- GBP/USD is trading higher for the sixth consecutive day. It is currently trading near the daily low at around 1.3190.
- GBP/USD broke above a daily trendline suggesting that a sustained breakout above 1.3200 could mean the end of the main bear trend. It could lead to a bear capitulation and an acceleration of the current bull leg. On the other hand, failure to conclusively breakout above 1.3200 should lead to sideways trading at best and a resumption of the bear trend at worst.
- The major hurdles to overcome for bulls are the 1.3200, 1.3230 and 1.3250 levels. Cable bulls have currently the short-term trend on their side but they will have to prove their strength in taking over the 1.3200 level.
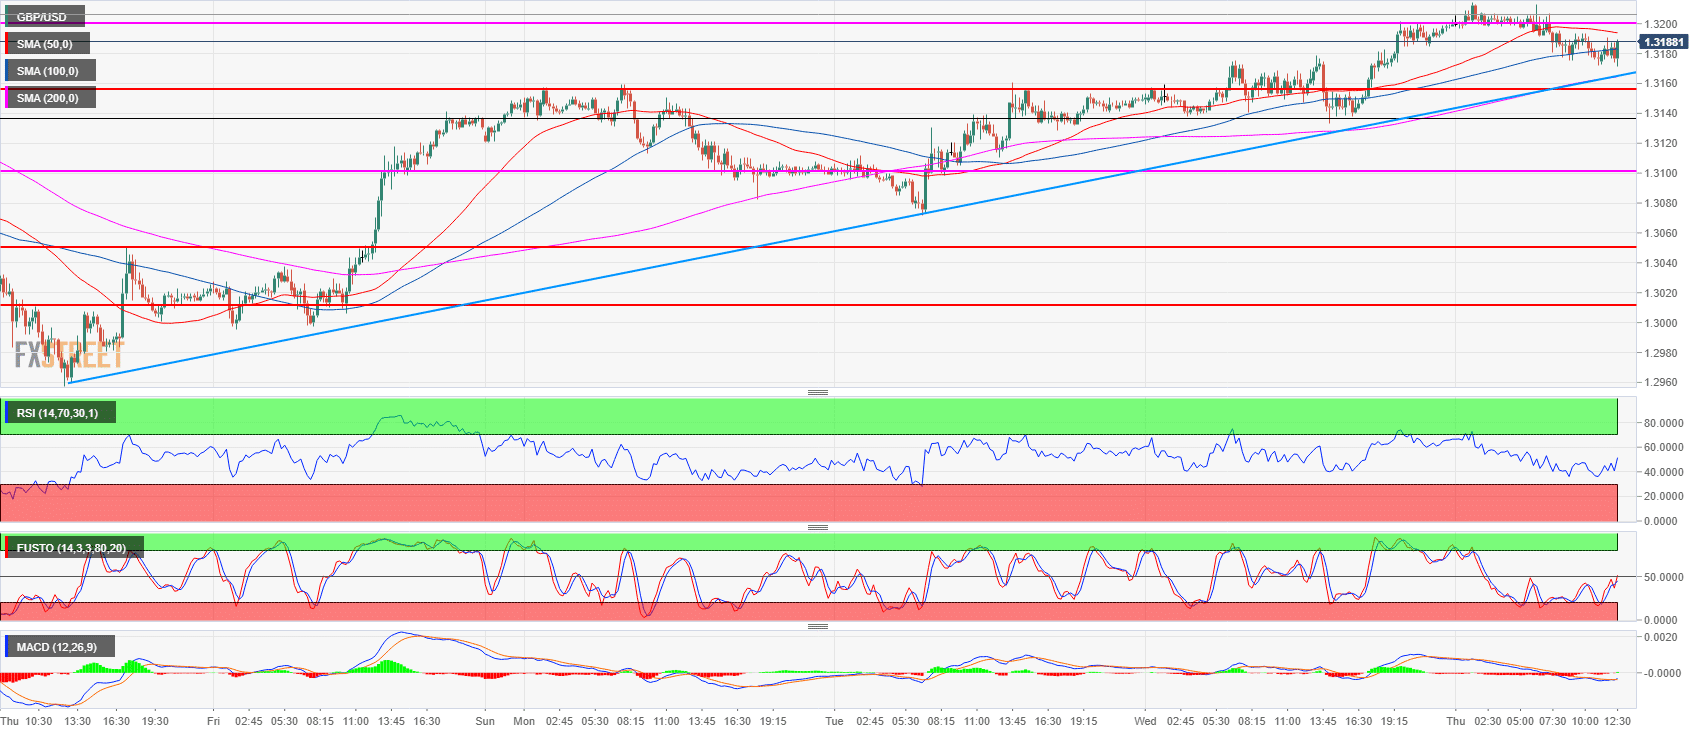
Spot rate: 1.3185
Relative change: -0.04%
High: 1.3214
Low: 1.3171
Trend: Bearish / Risk of bullish reversal above 1.3200
Resistance 1: 1.3200 figure
Resistance 2: 1.3230 supply level
Resistance 3: 1.3250 June 4 high
Support 1: 1.3155 former breakout point
Support 2: 1.3100 figure
Support 3: 1.3049 June 28 low
Support 4: 1.3010 July 18 low
Support 5: 1.2957 current 2018 low
Support 6: 1.2908 September 5, 2017 low
