Home GBP/USD Technical Analysis: Mission Accomplished as Cable bulls reach 1.3200 figure – Is it time to sell ?
FXStreet News

GBP/USD Technical Analysis: Mission Accomplished as Cable bulls reach 1.3200 figure – Is it time to sell ?

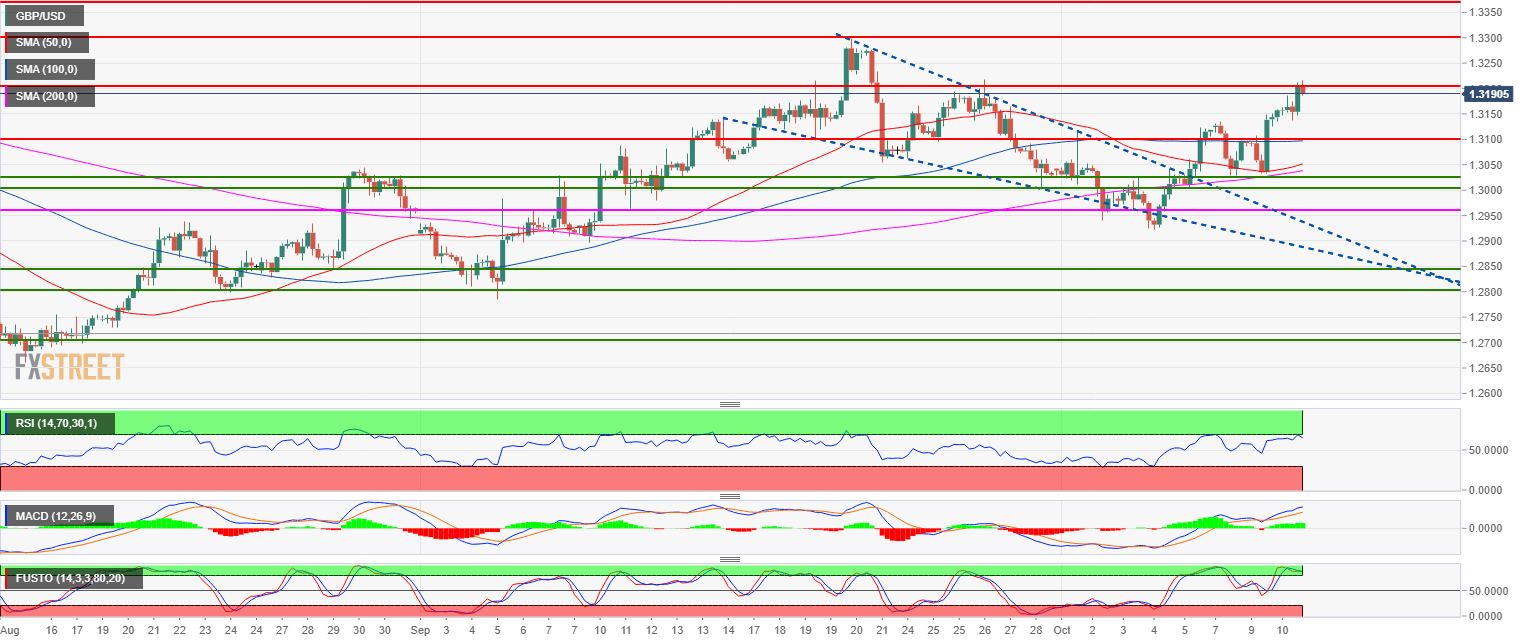
  • GBP/USD is in a bull trend as the market is above the 50, 100 and 200-period simple moving average.
  • After breaking from the bull flag, GBP/USD reached the 1.3200 figure. GBP/USD is facing resistance at the 1.3200 level while the Stochastic indicator is in overbought condition. While the bias remains bullish the market might need to correct to 1.3150 (September 21 low) or   even to 1.3100 figure before potentially resuming the bull trend.  
  • A bear breakout below 1.2957 would likely invalidate the bullish bias.

GBP/USD 4-hour chart

Spot rate:                         1.3213
Relative change:              0.54%      
High:                                1.3213
Low:                                 1.3133

Main trend:                      Bullish

Resistance 1:                  1.3200 figure
Resistance 2:                  1.3300 figure
Resistance 3:                  1.3370 July 9 high

Support 1:                      1.3150 September 21 low
Support 2:                      1.3100 figure
Support 3:                      1.3050 August 30 swing high, key level
Support 4:                      1.3028 October 8 low
Support 5:                      1.3000 figure  
Support 6:                      1.2957 July 19 swing low  

FX Street

FX Street

FXStreet is the leading independent portal dedicated to the Foreign Exchange (Forex) market. It was launched in 2000 and the portal has always been proud of their unyielding commitment to provide objective and unbiased information, to enable their users to take better and more confident decisions.