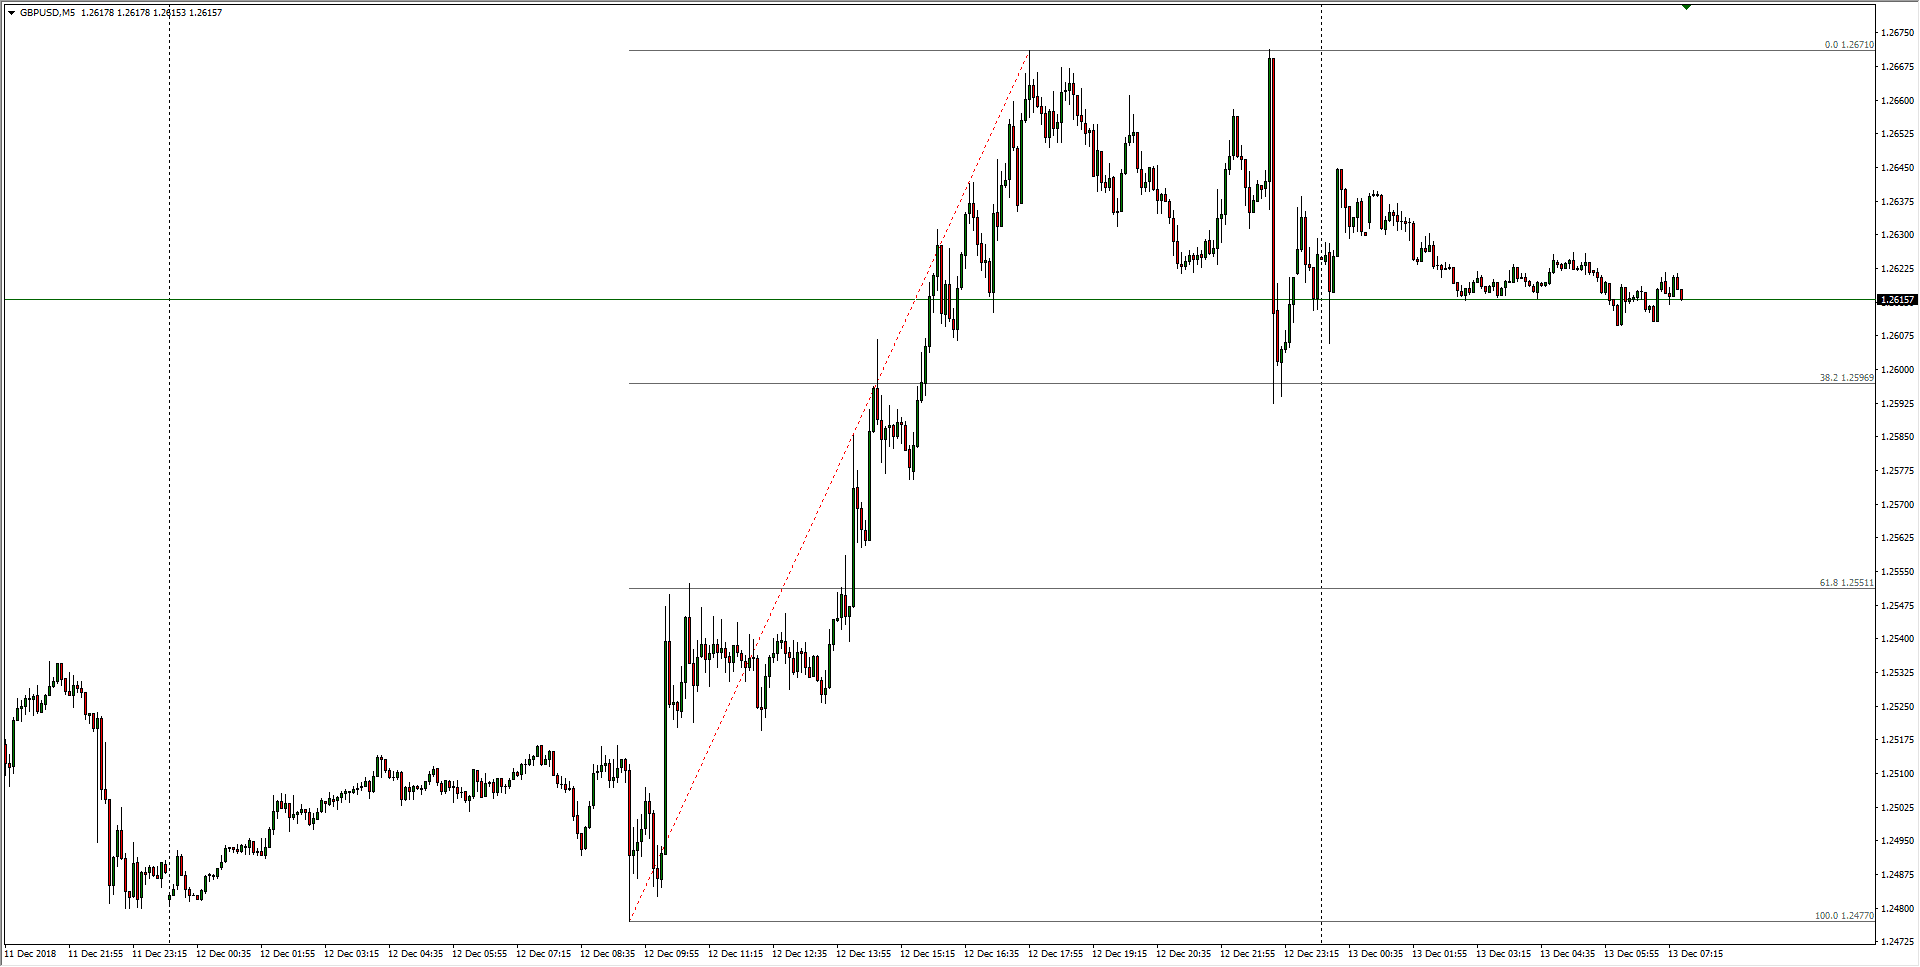
- The Sterling is already drifting back into intraday support from the 38.2% Fibo level just shy of 1.2600 as GBP/USD eases away from Wednesday’s peak reached in a run-up from 1.2477.
GBP/USD, 5-Minute
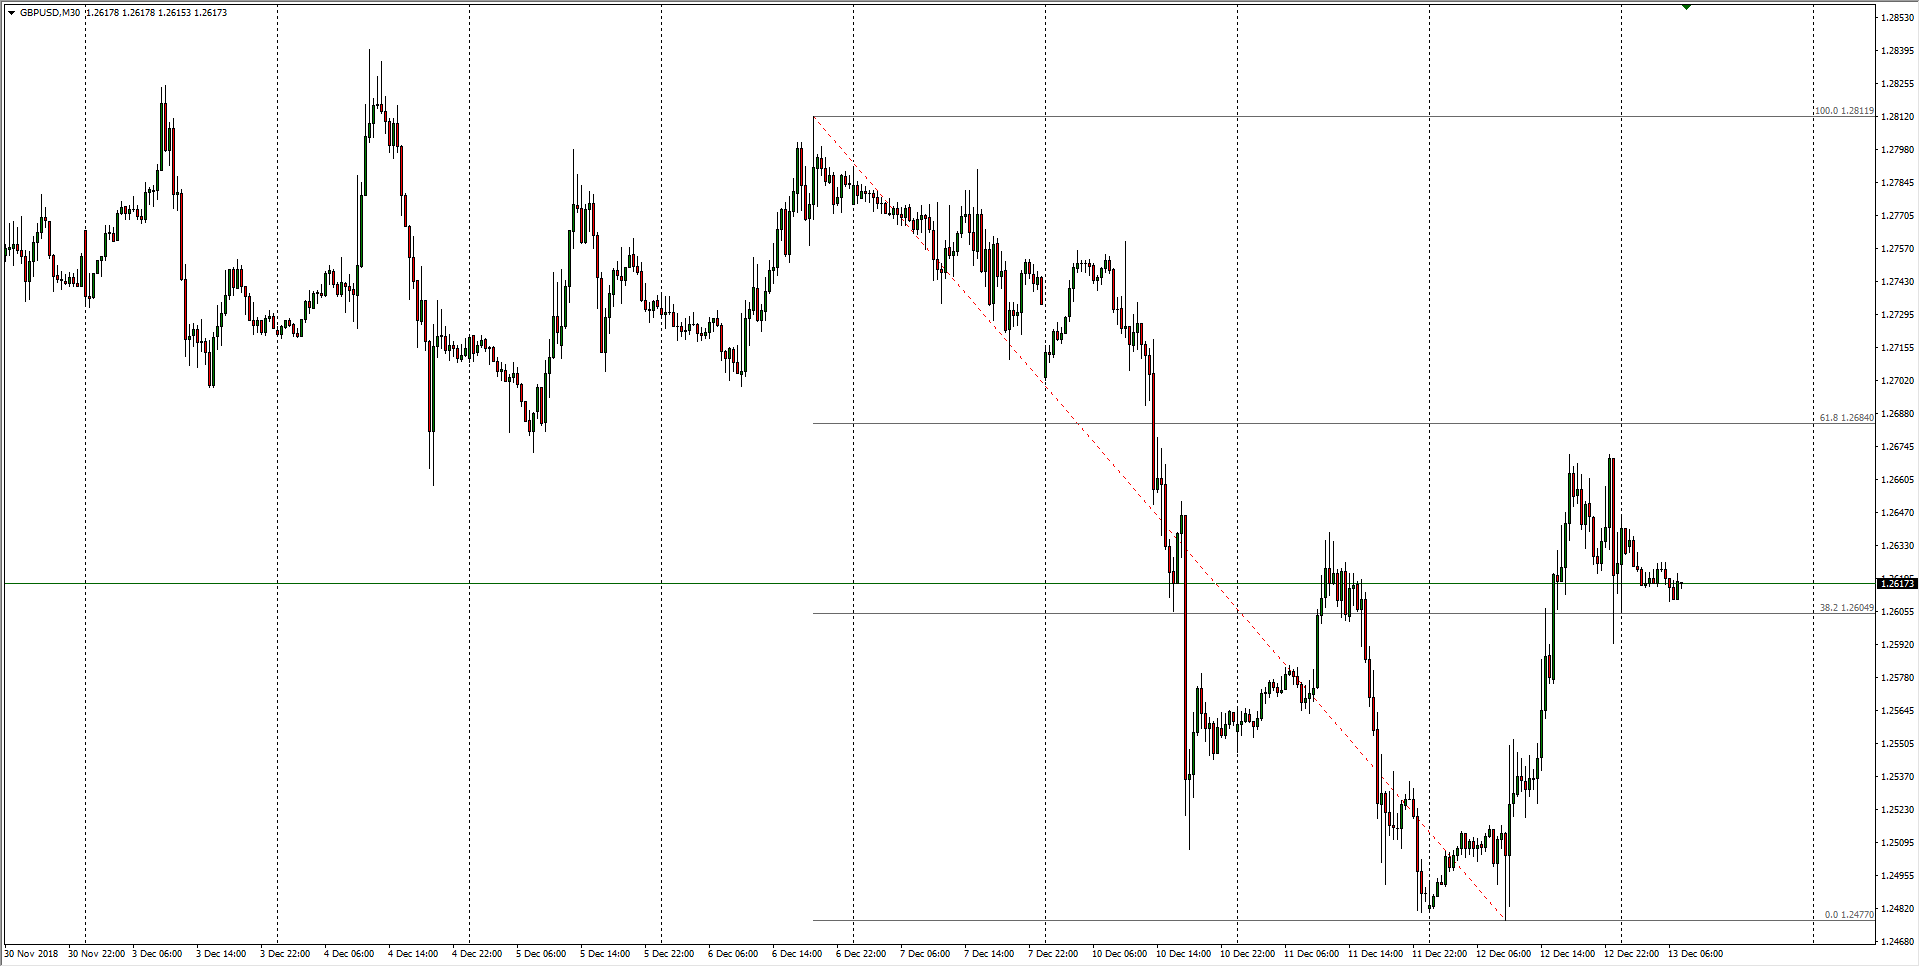
- In the near-term, the Cable could be geared for another step lower after failing to recover beyond the 61.8% Fibo retracement of the last swing high at 1.2685.
GBP/USD, 30-Minute
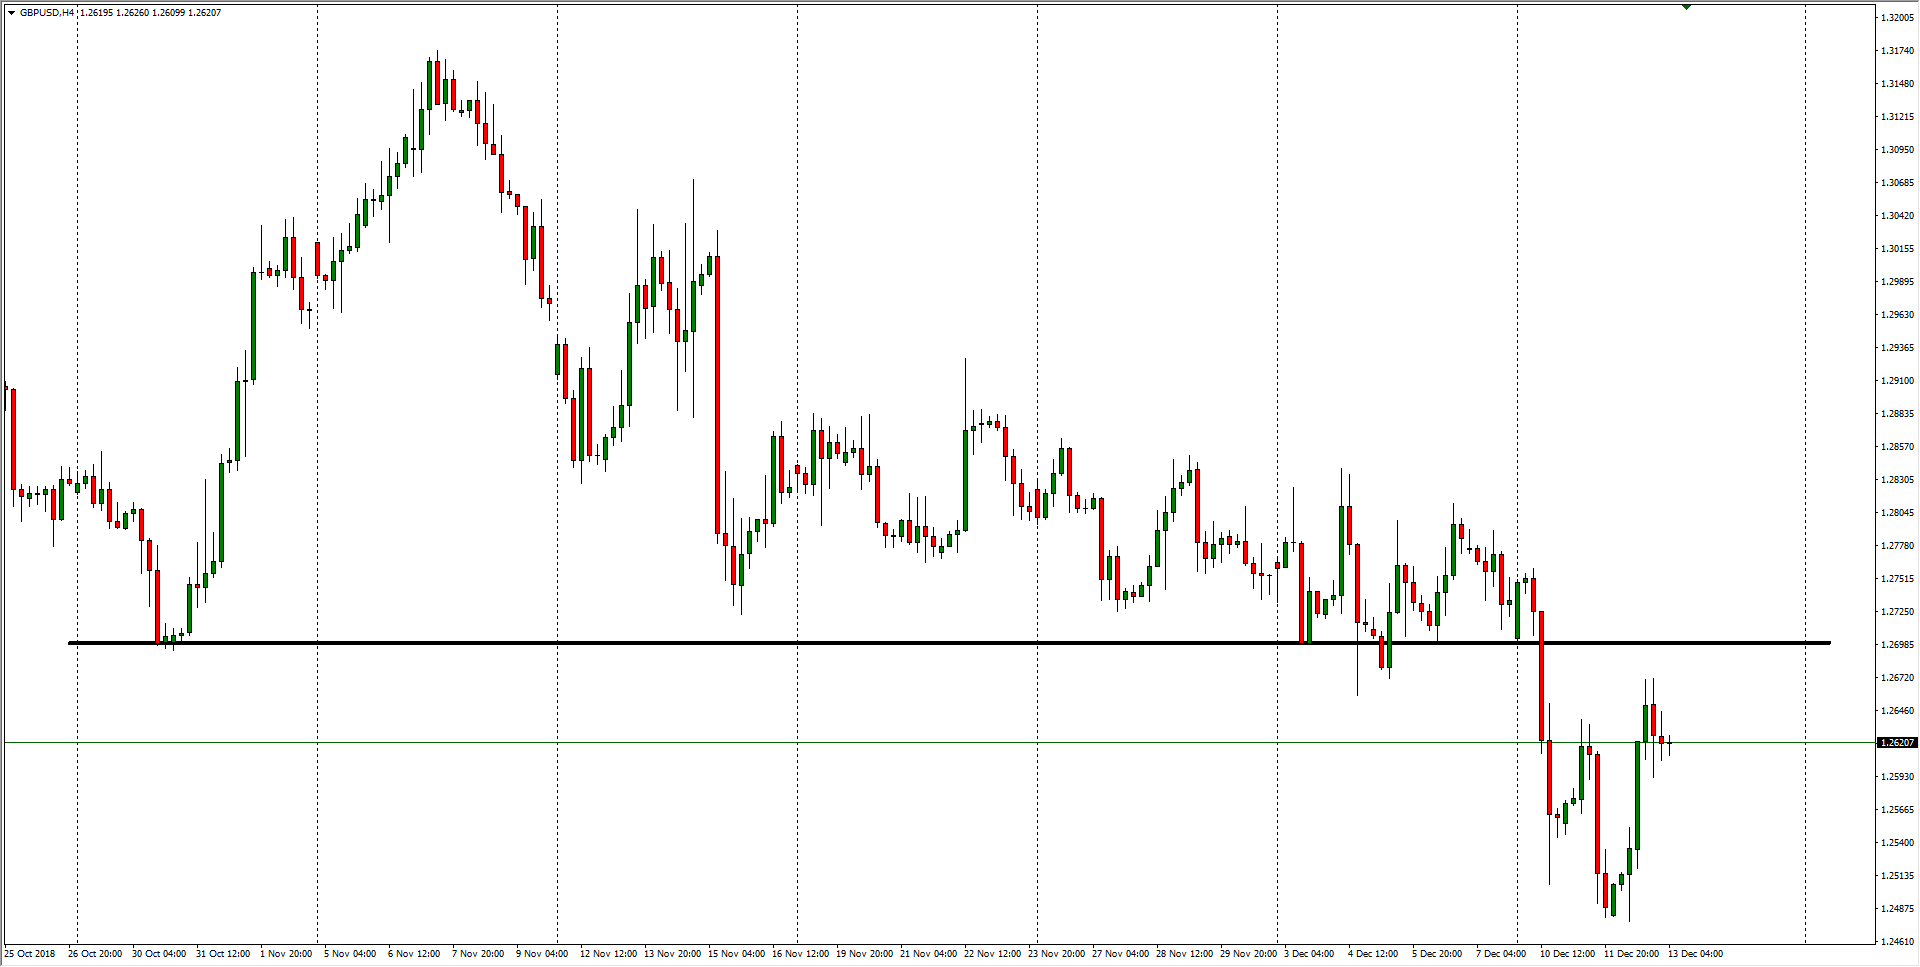
- A significant line in the sand has been drawn at the 1.2700 level, which could see any further bull moves rejected flat-out as the Cable grinds into a new sideways pattern.
GBP/USD, 4-Hour
GBP/USD
Overview:
Today Last Price: 1.2617
Today Daily change: -54 pips
Today Daily change %: -0.426%
Today Daily Open: 1.2671
Trends:
Previous Daily SMA20: 1.2752
Previous Daily SMA50: 1.2907
Previous Daily SMA100: 1.2941
Previous Daily SMA200: 1.3269
Levels:
Previous Daily High: 1.2672
Previous Daily Low: 1.2477
Previous Weekly High: 1.284
Previous Weekly Low: 1.2659
Previous Monthly High: 1.3176
Previous Monthly Low: 1.2723
Previous Daily Fibonacci 38.2%: 1.2598
Previous Daily Fibonacci 61.8%: 1.2551
Previous Daily Pivot Point S1: 1.2541
Previous Daily Pivot Point S2: 1.2411
Previous Daily Pivot Point S3: 1.2346
Previous Daily Pivot Point R1: 1.2736
Previous Daily Pivot Point R2: 1.2802
Previous Daily Pivot Point R3: 1.2932
