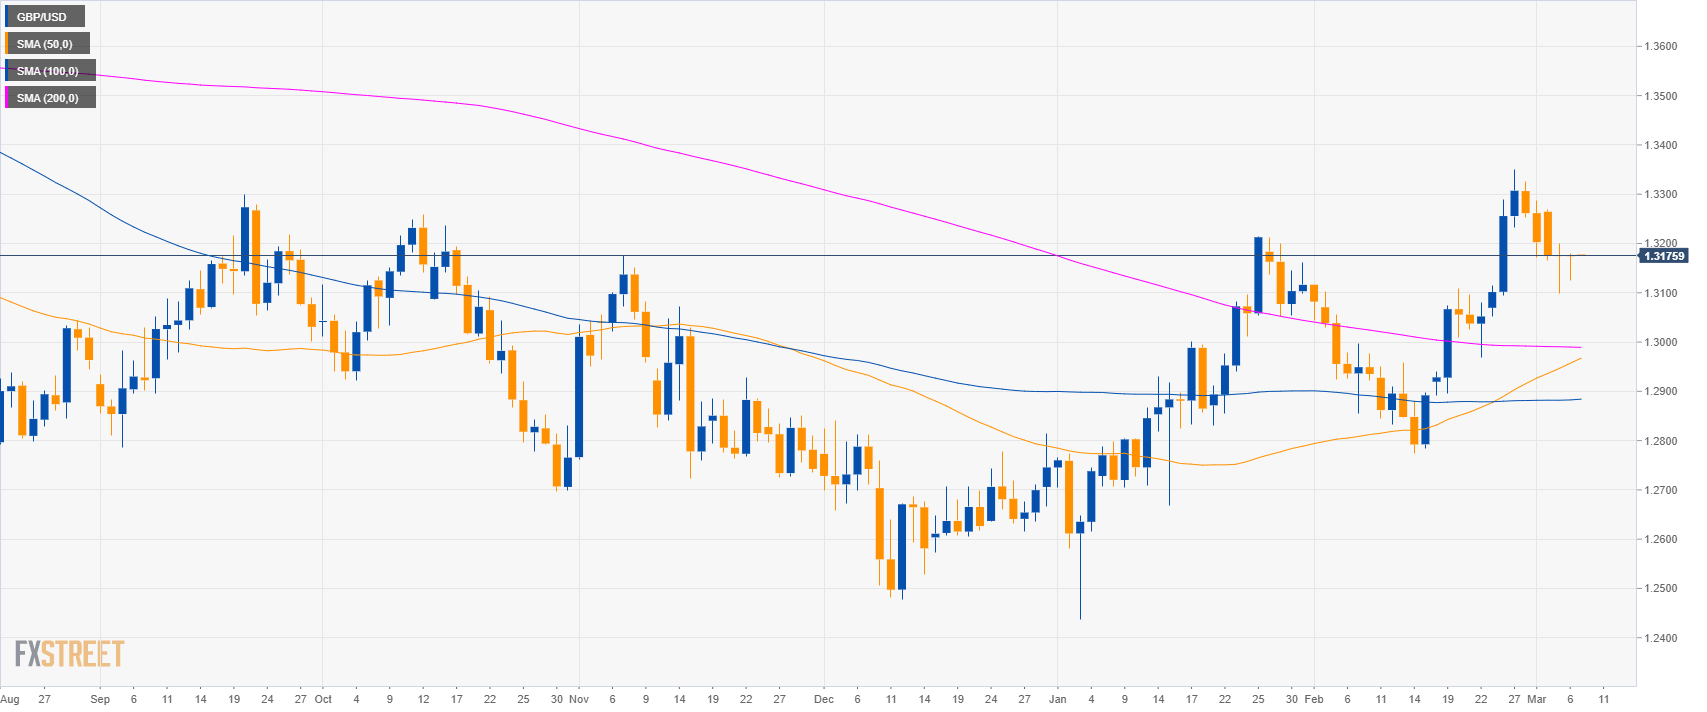
GBP/USD daily chart
- GBP/USD is trading in a bull leg above its main simple moving averages (SMA).
- GBP/USD created an inside bar on the daily chart.
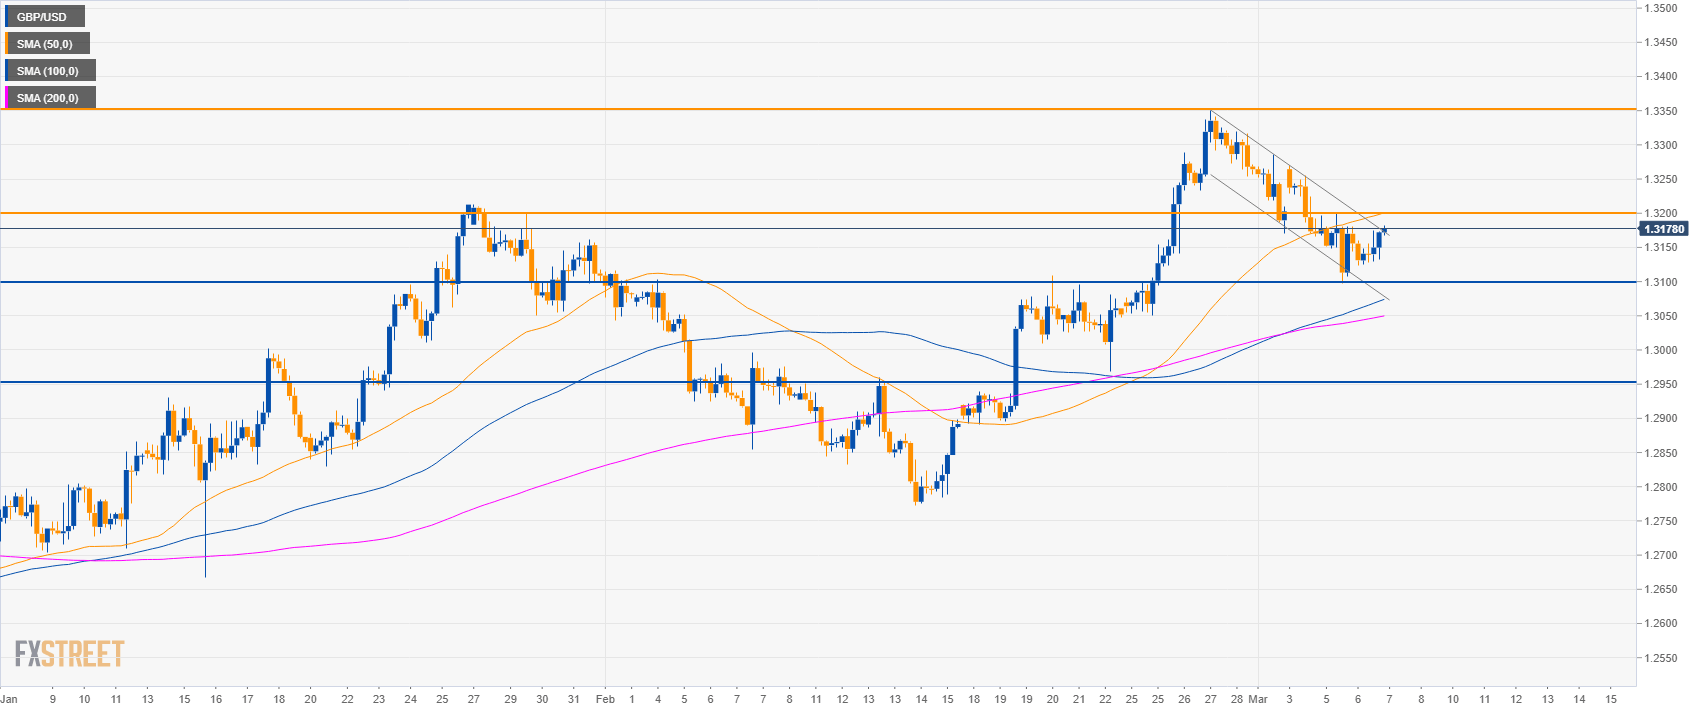
GBP/USD 4-hour chart
- Bulls are breaking to the upside from the bull flag as the market is trading above the 100 and 200 SMAs.
- The next resistances are at 1.3200 figure and 1.3350 swing high to the upside.
- On the flip side, a bear break below 1.3100 could lead to 1.2950 level.
Additional key levels
GBP/USD
Overview:
Today Last Price: 1.3178
Today Daily change %: 0.02%
Today Daily Open: 1.3176
Trends:
Daily SMA20: 1.3037
Daily SMA50: 1.2946
Daily SMA100: 1.2882
Daily SMA200: 1.299
Levels:
Previous Daily High: 1.3199
Previous Daily Low: 1.3098
Previous Weekly High: 1.3351
Previous Weekly Low: 1.3051
Previous Monthly High: 1.3351
Previous Monthly Low: 1.2773
Daily Fibonacci 38.2%: 1.3136
Daily Fibonacci 61.8%: 1.316
Daily Pivot Point S1: 1.3116
Daily Pivot Point S2: 1.3056
Daily Pivot Point S3: 1.3015
Daily Pivot Point R1: 1.3218
Daily Pivot Point R2: 1.3259
Daily Pivot Point R3: 1.3319
