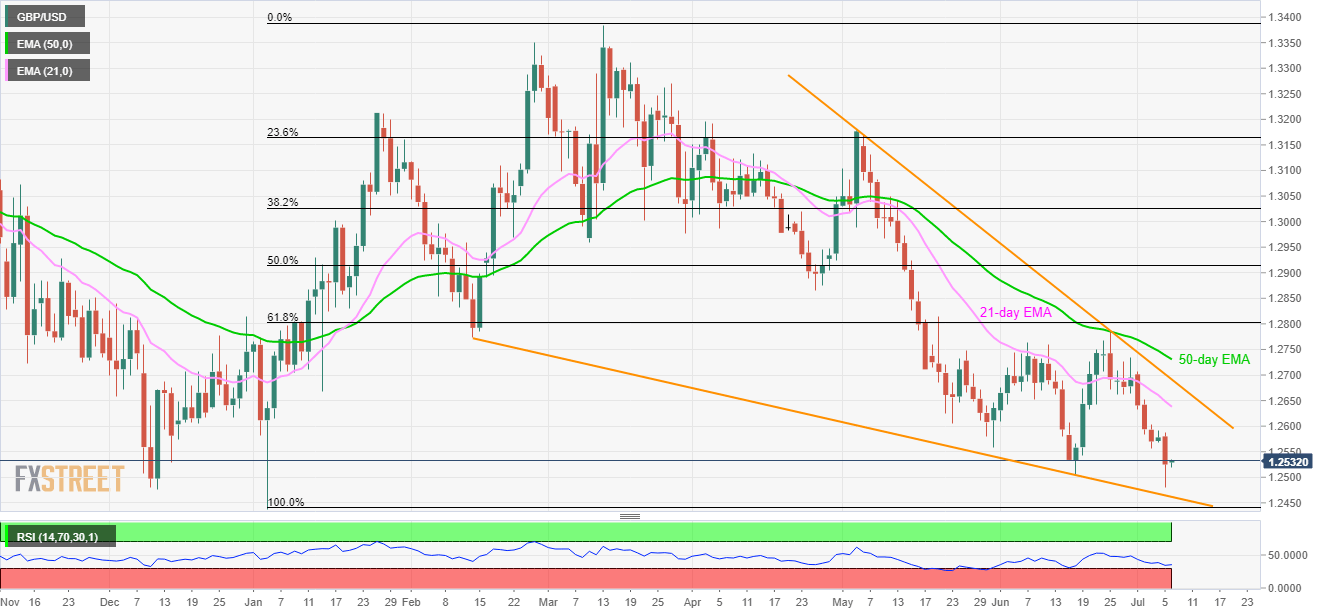
- Sustained trading below 61.8% Fibonacci retracement, 50-day EMA drags the GBP/USD pair downward.
- Five-month-old descending trend-line, late-2018 and early year lows can challenge sellers as RSI remains oversold.
GBP/USD’s failure to decline beneath 6-month low flashed on Friday favors the odds for the quote’s recovery as it takes the rounds to 1.2530 while heading into the UK open on Monday.
Not only December 2018 low of 1.2477 and the current year bottom around 1.2438 but a descending trend-line since mid-February, forming part of a broad falling wedge, also limits the pair’s declines around 1.2460.
If bears refrain from respecting oversold conditions of 14-day relative strength index (RSI), April 2017 low surrounding 1.2366 could become their favorite.
On the contrary, 1.2600 and 21-day exponential moving average (EMA) level close to 1.2640 can keep limiting pair’s near-term upside.
However, pair’s advances past-1.2640 may find it hard to cross 9-week old trend-line resistance of 1.2691, a break of which will confirm the bullish technical pattern in turn supporting the price rally towards 1.3300 theoretical figure.
GBP/USD daily chart
Trend: Pullback expected
