- GBP/USD stays above 200-bar SMA after bouncing off the same on Friday.
- The monthly resistance line holds the key to October month top.
Following its successful recovery from 200-bar SMA, GBP/USD seesaws around 1.2900 by the press time of Tuesday’s Asian session.
The quote now aims to confront a downward sloping trend line since October 21, at 1.2980, a break of which will accelerate the pair’s run-up towards the previous month top near 1.3015 and then to 1.3100 round-figure.
Meanwhile, sellers wait for the pair’s declines below 200-bar Simple Moving Average (SMA) level of 1.2855 to target the monthly low near 1.2770.
Given the quote’s extended south-run past-1.2770, October 11 high near 1.2710 and 61.8% Fibonacci retracement of the previous month rise, close to 1.2510, will be on the bears’ radar.
GBP/USD 4-hour chart
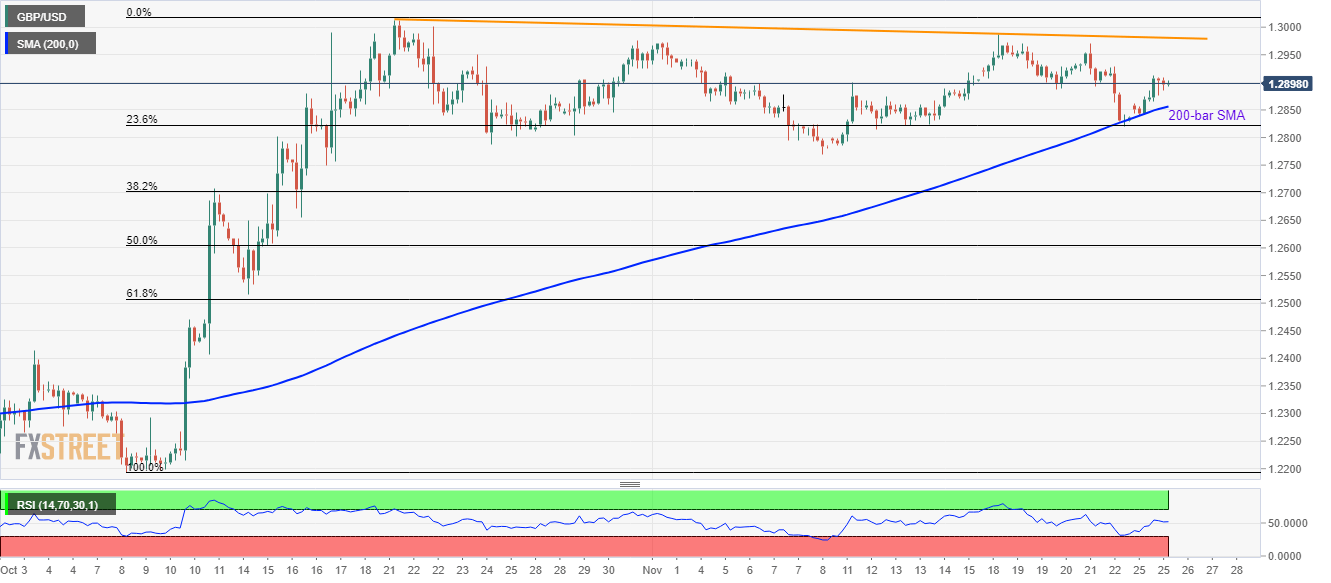
Trend: Bullish
