- GBP/USD pulls back from 50% Fibonacci retracement towards seven-day-old support-line (previous resistance).
- An 11-day long rising trend-line becomes the key during further declines.
GBP/USD takes a U-turn from 50% Fibonacci retracement of July-August downturn as it trades near 1.2214 during the Asian session on Tuesday.
An upward sloping trend-line since August 16, at 1.2200, becomes immediate support to watch as a break of which can drag prices further down to 23.6% Fibonacci retracement level of 1.2148.
It should, however, be noted that pair’s declines below 1.2148 may bounce off 11-day support-line, at 1.2100, if not then odds of witnessing another downturn to 1.2050 and 1.2015 can’t be denied.
On the contrary, pair’s run-up beyond 50% Fibonacci retracement level of 1.2300 can recall 1.2365 level, including 61.8% Fibonacci retracement, back to the chart while 1.2380 and 1.2420 could question further advances.
GBP/USD 4-hour chart
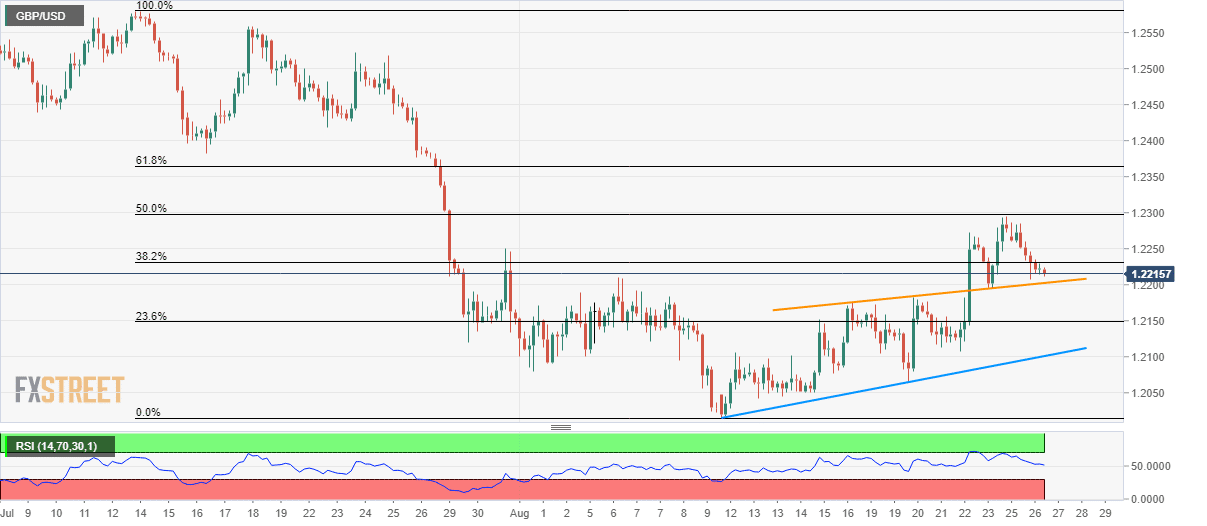
Trend: Pullback expected
