- GBP/USD fails to cross near-term key resistance-confluence amid overbought RSI.
- 23.6% of Fibonacci retracement acts as immediate support.
With the 4H 200MA and a falling trend-line since June 25 limiting the GBP/USD pair’s near-term upside, the quote witnesses pullback to 1.2245 during Friday’s Asian session.
As a result, prices are likely to visit 23.6% Fibonacci retracement of June-August downpour, at 1.2200 whereas 1.2180 and a nine-day long descending support-line at 1.2080 will be crucial to watch afterward.
In a case where the quote slips below 1.2080, 1.2050 and 1.2015 hold the gates to a downward trajectory towards 2017 low near 1.1987.
On the contrary, pair’s sustained break of 1.2271/78 resistance-confluence, comprising 200-bar moving average on the four-hour chart and near-term falling trend-line, can confront 38.2% Fibonacci retracement level of 1.2310.
If bulls keep ignoring overbought conditions of 14-bar relative strength index (RSI) beyond 1.2310 price level, July 17 bottom surrounding 1.2380 will be on their radars.
GBP/USD 4-hour chart
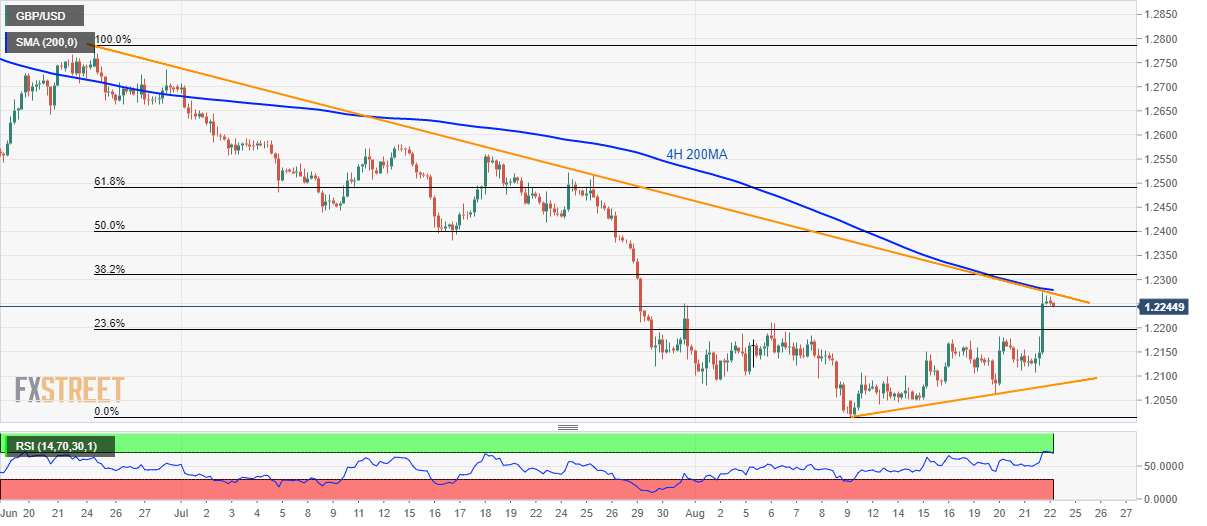
Trend: Pullback expected
