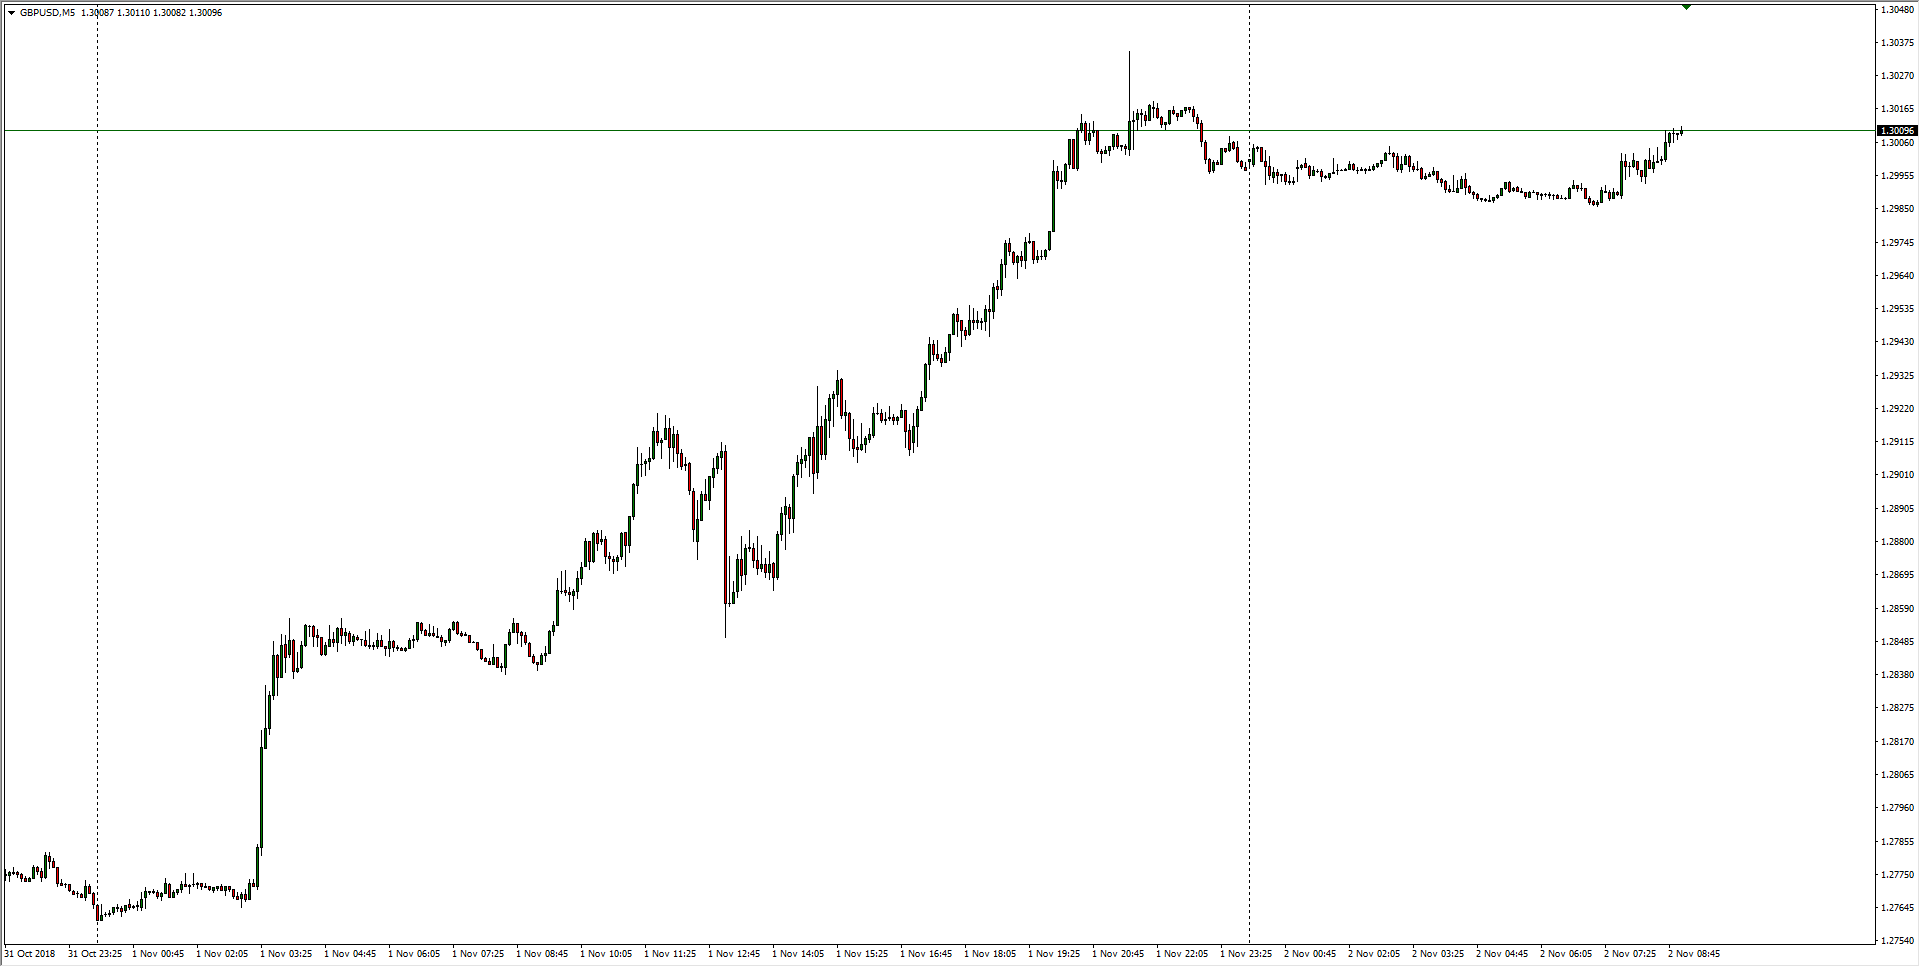
- The GBP/USD remains pinned to the 1.3000 handle after Thursday’s 250-someodd pip rise on refreshed Brexit hopes, and the pair remains pushed into near-term highs.
GBP/USD M5
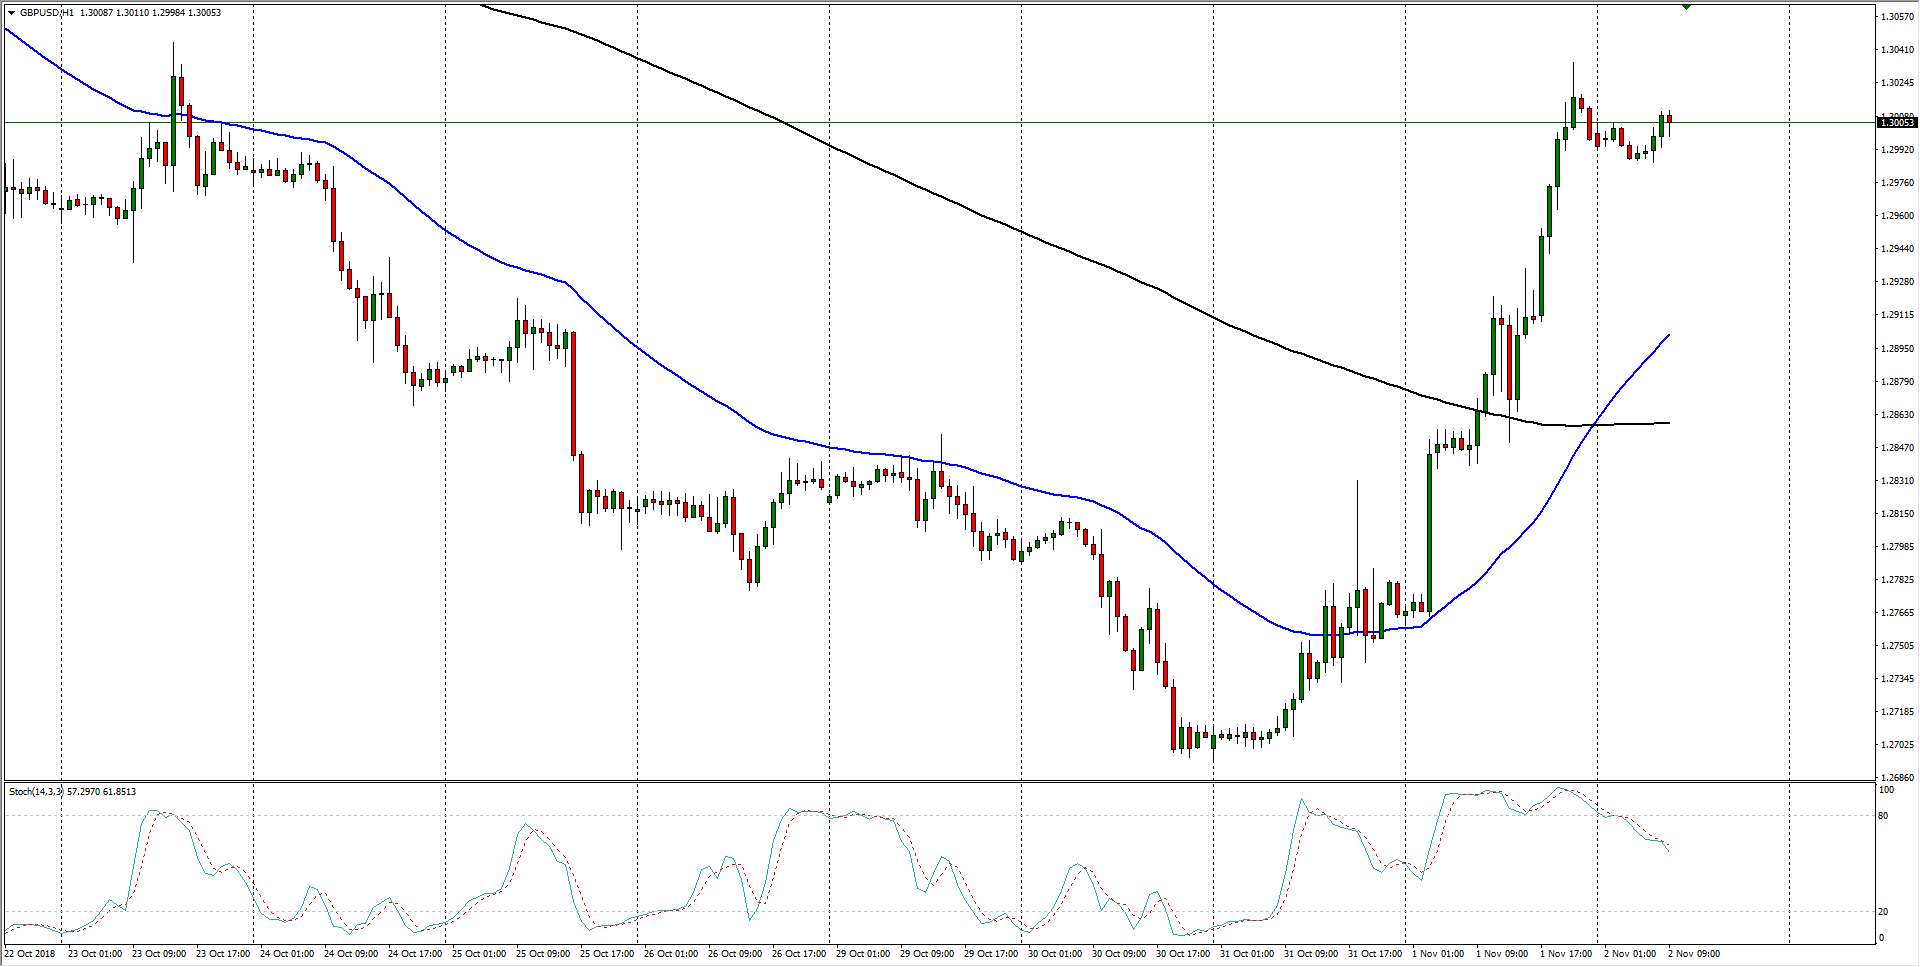
Hourly candles show the Cable has blown right past the 200-hour moving average at 1.2860, and the 50-hour moving average has inverted the pair’s near-term bias, setting in a potential floor at the 1.2900 handle.
GBP/USD H1
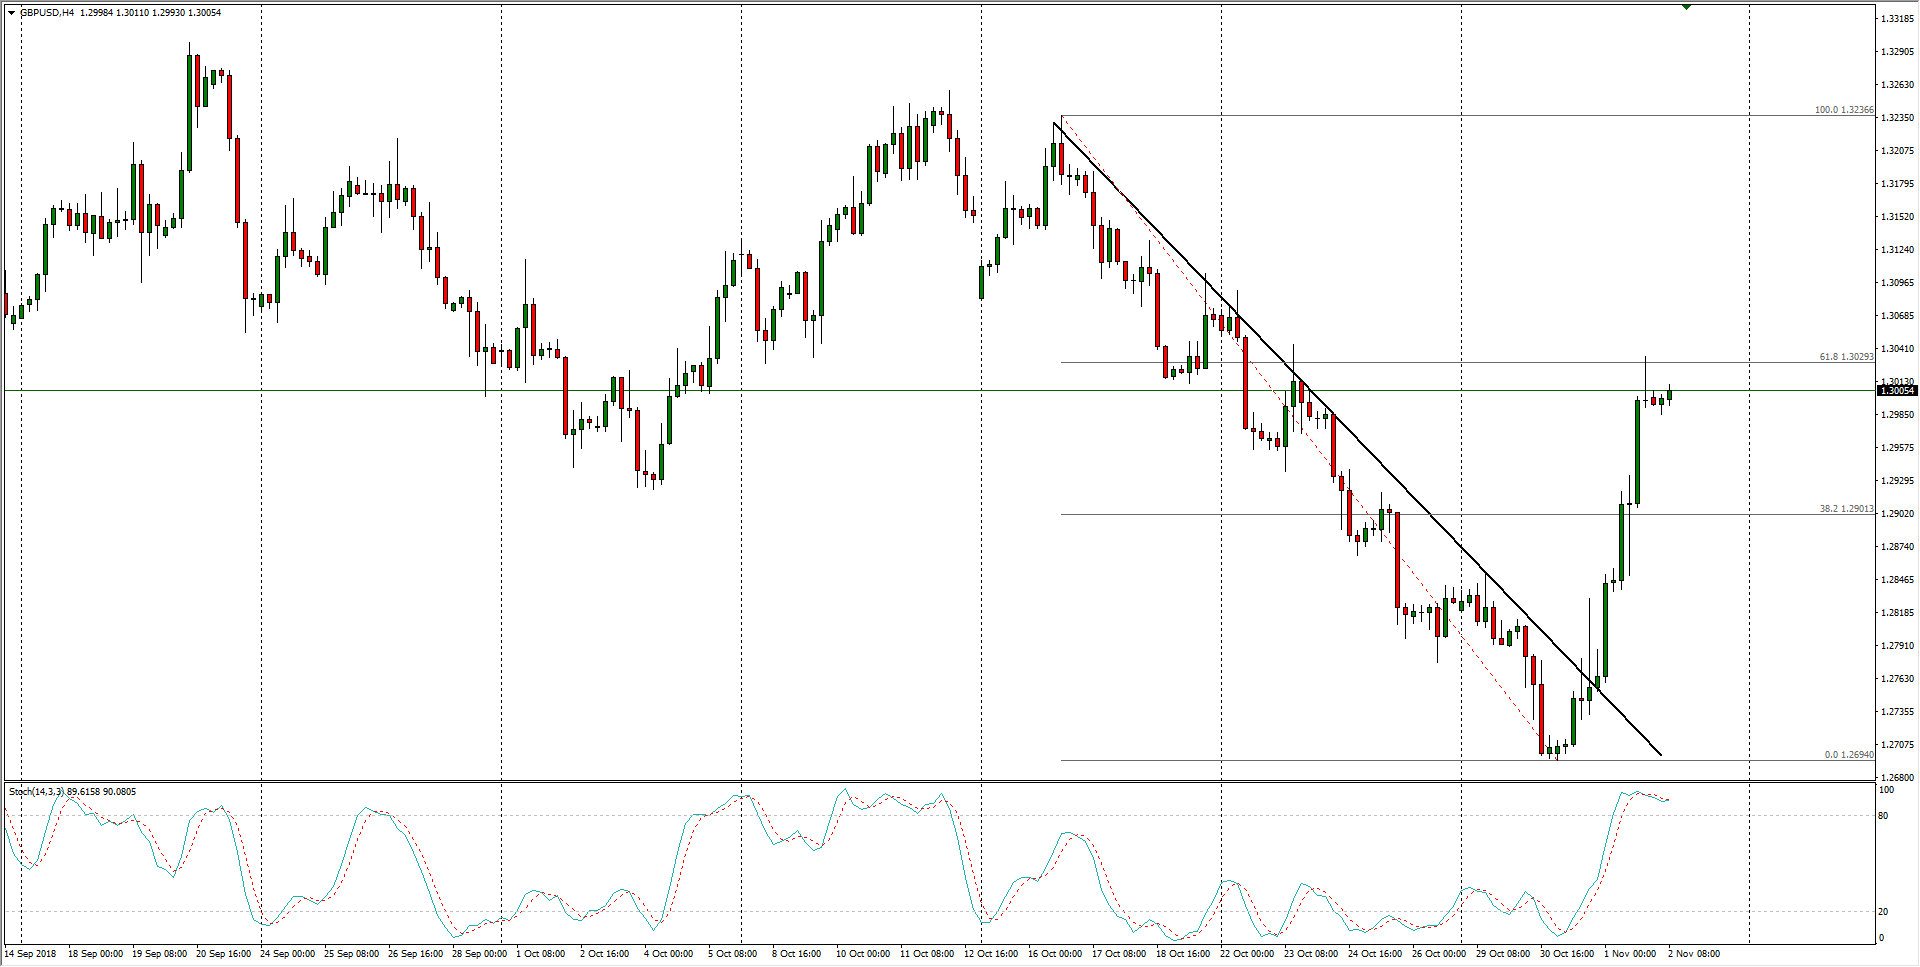
- The past three weeks have seen the Cable steeply off of early October’s highs, and yesterday’s trendline break sees the GBP/USD making a clean challenge of the 61.8% Fibo level neat 1.3030, and buyers could see challenges heading into Friday’s action.
GBP/USD H4
Don’t forget to check out FXStreet’s own live chart to see instant updates on the GBP/USD!
GBP/USD
Overview:
Last Price: 1.3006
Daily change: 1.0 pips
Daily change: 0.00769%
Daily Open: 1.3005
Trends:
Daily SMA20: 1.3011
Daily SMA50: 1.3019
Daily SMA100: 1.3045
Daily SMA200: 1.3436
Levels:
Daily High: 1.3036
Daily Low: 1.2762
Weekly High: 1.3092
Weekly Low: 1.2777
Monthly High: 1.326
Monthly Low: 1.2696
Daily Fibonacci 38.2%: 1.2932
Daily Fibonacci 61.8%: 1.2867
Daily Pivot Point S1: 1.2833
Daily Pivot Point S2: 1.266
Daily Pivot Point S3: 1.2558
Daily Pivot Point R1: 1.3107
Daily Pivot Point R2: 1.3209
Daily Pivot Point R3: 1.3382
