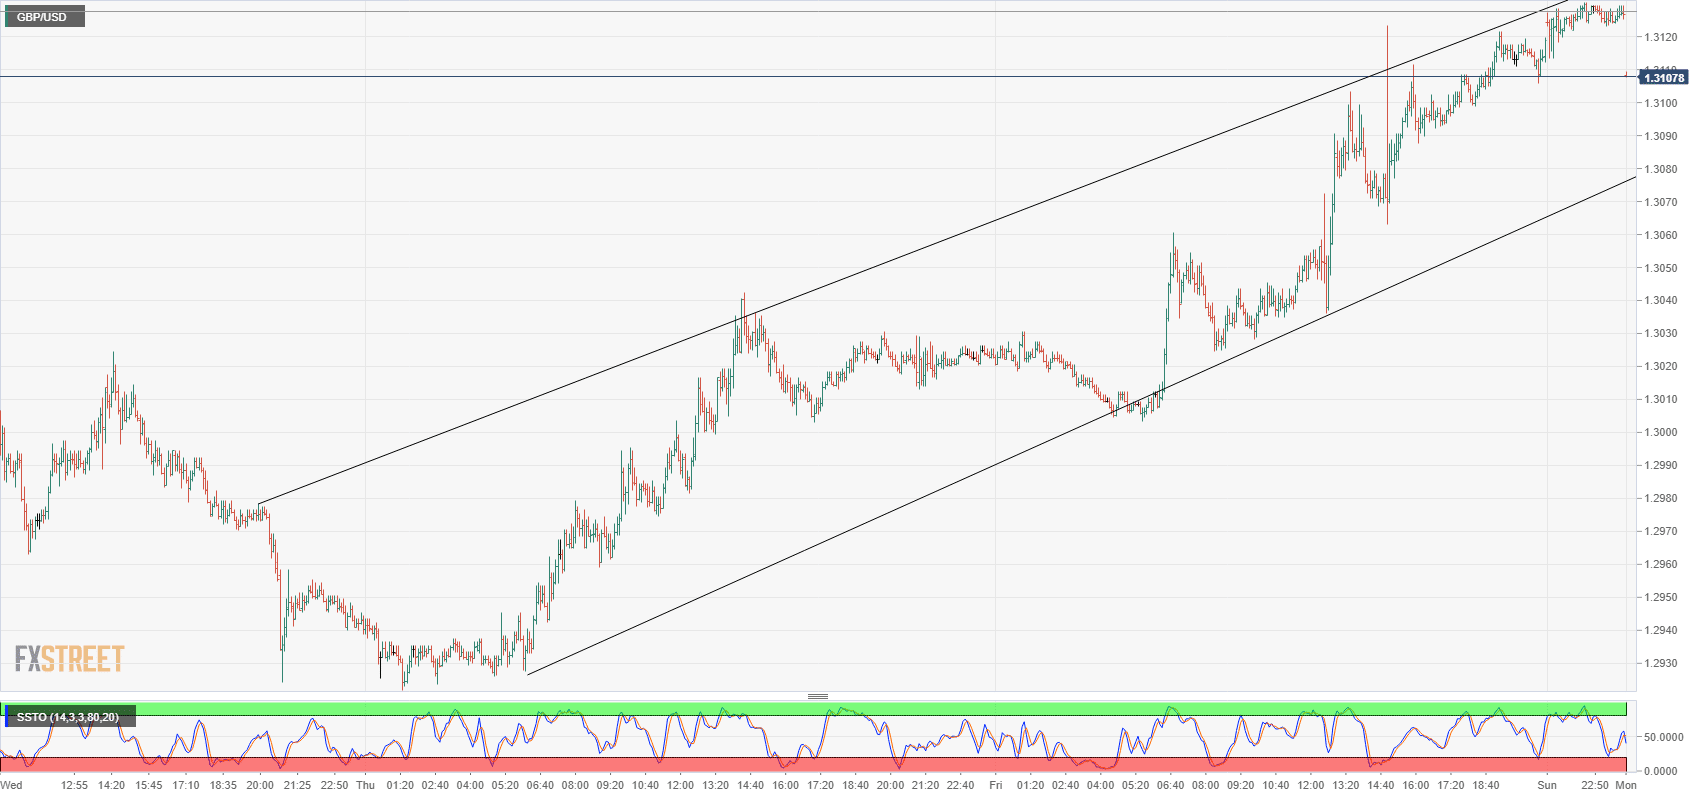
- The Cable is pushing along the high side of a rising channel as the GBP gets bolstered across broader markets by hopes for a workable Brexit solution to be potentially offered this week, driving the GBP/USD above 1.31.
- The GBP index is currently sitting just shy of 72.50, a five-month high for the Sterling against the broader G10 on a relative basis, compared to 2018’s low of 69.49 in mid-August, and the index is leaning firmly towards more gains.
- With the intraday chart clattering into the top of a rising trendline, a mild pullback could be expected before bulls step in again and resume lifting.
GBP/USD
Overview:
Last Price: 1.3107
Daily change: -12 pips
Daily change: -0.0915%
Daily Open: 1.3119
Trends:
Daily SMA20: 1.3088
Daily SMA50: 1.2973
Daily SMA100: 1.3111
Daily SMA200: 1.3499
Levels:
Daily High: 1.3123
Daily Low: 1.3003
Weekly High: 1.3123
Weekly Low: 1.2922
Monthly High: 1.33
Monthly Low: 1.2897
Daily Fibonacci 38.2%: 1.3077
Daily Fibonacci 61.8%: 1.3049
Daily Pivot Point S1: 1.304
Daily Pivot Point S2: 1.2962
Daily Pivot Point S3: 1.292
Daily Pivot Point R1: 1.316
Daily Pivot Point R2: 1.3202
Daily Pivot Point R3: 1.328
