- GBP/USD remains under some selling pressure for the second straight session.
- Weakness below 1.3135-30 region was seen as a key trigger for bearish traders.
The GBP/USD pair witnessed some follow-through selling for the second consecutive session on Friday and dropped to the lower end of its weekly trading range on softer UK PMI.
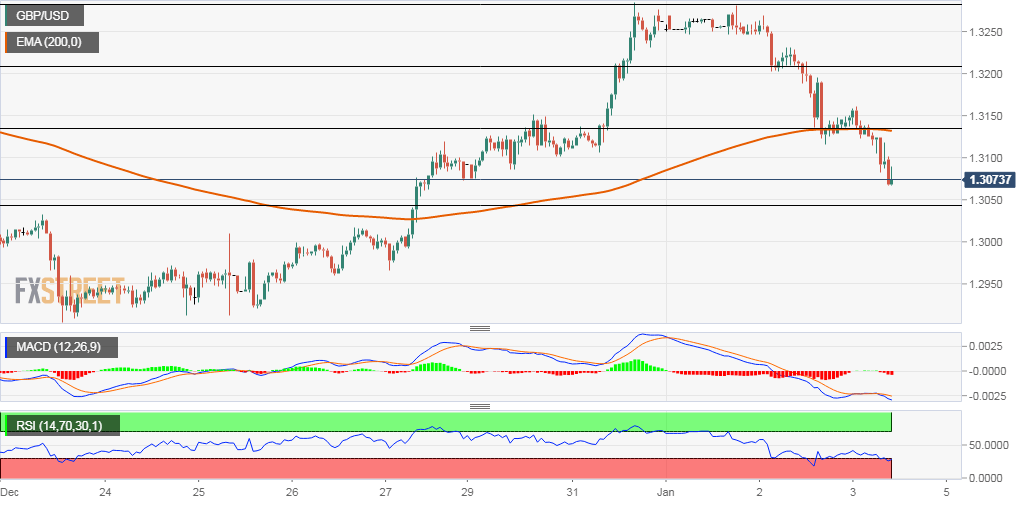
Sustained weakness below the 1.3135-30 confluence support – 200-hour EMA and 38.2% Fibonacci level of the 1.3515-1.2905 downfall – was seen as a key trigger for bearish traders.
Meanwhile, technical indicators on hourly charts maintained their bearish bias and support prospects for a further near-term depreciating move amid persistent fears of a no-deal Brexit.
However, oscillators on the daily chart, though have been losing traction, are yet to confirm the negative bias and thus, warrant some caution before placing any aggressive bearish bets.
Nevertheless, the pair still seems poised to extend the fall towards 23.6% Fibo. level, near the 1.3030 region, which if broken will set the stage for extension of the recent corrective slide from over 18-month tops set in December.
On the flip side, the 1.3155-60 region now seems to have emerged as an immediate resistance, above which the pair might head back towards testing 50% Fibo. level near the 1.3195-1.3200 supply zone.
A subsequent strength beyond the 1.3230 resistance level has the potential to lift the pair further towards its next major hurdle near the 1.3265-70 region (61.8% Fibo. tested earlier this week).
GBP/USD 1-hourly chart